ComCat M6.7 (ci3144585), ShakeMap Surface, kCOV=1.5, MaxPtSrcM=5 Results
| ComCat M6.7 (ci3144585), ShakeMap Surface, kCOV=1.5, MaxPtSrcM=5 | |
|---|---|
| Num Simulations | 100000 |
| Start Time | 1994/01/17 12:30:56 UTC |
| Start Time Epoch Milliseconds | 758809856390 |
| Duration | 10 Years |
| Includes Spontaneous? | false |
| Trigger Ruptures | (none) |
| Config Generated With | u3etas_comcat_event_config_builder.sh --output-dir /expanse/lustre/projects/ddp408/ux454496/ucerf3_etas_test_cases/benchmark_1/data/20241017T210255-34546712/ --event-id ci3144585 --num-simulations 100000 --days-before 7 --etas-k-cov 1.5 --finite-surf-shakemap --finite-surf-shakemap-min-mag 6 --max-point-src-mag 5 --radius 40 --random-seed 123456789 --binary-output --nodes 14 --hours 3 --queue compute |
Table Of Contents
- Probabilities Summary Table
- Magnitude Number Distribution
- Hazard Change Over Time
- Trigger Rupture Fault Map
- Trigger Rupture Depth Map
- Fault Distances To Triggers
- Individual Simulated Catalog Maps
- ComCat Data Comparisons
- Section Participation
- Fault Magnitude-Probability Distributions
- Gridded Nucleation
- JSON Input File
Probabilities Summary Table
| Magnitude | 1 Hour Prob | 1 Day Prob | 1 Week Prob | 1 Month Prob | 1 Year Prob | 10 Year Prob |
|---|---|---|---|---|---|---|
| M≥3 | 0.997 (99.70%) | 1.000 (99.98%) | 1.000 (99.99%) | 1.000 (99.99%) | 1.000 (100.00%) | 1.000 (100.00%) |
| 95% Conf | [99.67% 99.74%] | [99.96% 99.98%] | [99.98% 99.99%] | [99.98% 100.00%] | [99.99% 100.00%] | [99.99% 100.00%] |
| M≥3.5 | 0.972 (97.20%) | 0.995 (99.50%) | 0.997 (99.72%) | 0.998 (99.81%) | 0.999 (99.90%) | 0.999 (99.93%) |
| 95% Conf | [97.09% 97.30%] | [99.46% 99.54%] | [99.69% 99.76%] | [99.78% 99.84%] | [99.88% 99.92%] | [99.91% 99.95%] |
| M≥4 | 0.862 (86.21%) | 0.958 (95.77%) | 0.974 (97.37%) | 0.980 (98.03%) | 0.987 (98.70%) | 0.990 (99.00%) |
| 95% Conf | [86.00% 86.43%] | [95.64% 95.89%] | [97.27% 97.47%] | [97.95% 98.12%] | [98.63% 98.77%] | [98.93% 99.06%] |
| M≥4.5 | 0.623 (62.31%) | 0.821 (82.07%) | 0.871 (87.08%) | 0.895 (89.52%) | 0.921 (92.11%) | 0.936 (93.60%) |
| 95% Conf | [62.00% 62.61%] | [81.83% 82.31%] | [86.87% 87.28%] | [89.32% 89.70%] | [91.94% 92.27%] | [93.45% 93.75%] |
| M≥5 | 0.345 (34.49%) | 0.567 (56.66%) | 0.646 (64.61%) | 0.689 (68.87%) | 0.744 (74.45%) | 0.780 (77.98%) |
| 95% Conf | [34.20% 34.79%] | [56.35% 56.97%] | [64.32% 64.91%] | [68.58% 69.15%] | [74.18% 74.72%] | [77.72% 78.23%] |
| M≥5.5 | 0.147 (14.70%) | 0.298 (29.76%) | 0.369 (36.85%) | 0.413 (41.26%) | 0.475 (47.55%) | 0.521 (52.14%) |
| 95% Conf | [14.48% 14.92%] | [29.47% 30.04%] | [36.55% 37.15%] | [40.96% 41.57%] | [47.24% 47.86%] | [51.83% 52.45%] |
| M≥6 | 0.050 (5.01%) | 0.119 (11.87%) | 0.158 (15.76%) | 0.185 (18.55%) | 0.228 (22.83%) | 0.263 (26.29%) |
| 95% Conf | [4.88% 5.15%] | [11.67% 12.07%] | [15.54% 15.99%] | [18.31% 18.79%] | [22.57% 23.09%] | [26.02% 26.56%] |
| M≥6.5 | 0.012 (1.21%) | 0.031 (3.11%) | 0.044 (4.38%) | 0.054 (5.40%) | 0.071 (7.11%) | 0.087 (8.68%) |
| 95% Conf | [1.15% 1.29%] | [3.01% 3.22%] | [4.26% 4.51%] | [5.26% 5.54%] | [6.95% 7.27%] | [8.51% 8.86%] |
| M≥6.7 | 8.34E-3 (0.83%) | 0.022 (2.18%) | 0.031 (3.09%) | 0.038 (3.83%) | 0.051 (5.12%) | 0.063 (6.29%) |
| 95% Conf | [0.78% 0.89%] | [2.09% 2.27%] | [2.99% 3.20%] | [3.71% 3.95%] | [4.98% 5.26%] | [6.14% 6.44%] |
| M≥7 | 3.01E-3 (0.30%) | 8.08E-3 (0.81%) | 0.012 (1.17%) | 0.015 (1.48%) | 0.021 (2.05%) | 0.026 (2.61%) |
| 95% Conf | [0.27% 0.34%] | [0.75% 0.87%] | [1.10% 1.24%] | [1.40% 1.55%] | [1.97% 2.15%] | [2.51% 2.71%] |
| M≥7.5 | 1.24E-3 (0.12%) | 3.46E-3 (0.35%) | 4.83E-3 (0.48%) | 6.19E-3 (0.62%) | 8.89E-3 (0.89%) | 0.011 (1.13%) |
| 95% Conf | [0.10% 0.15%] | [0.31% 0.38%] | [0.44% 0.53%] | [0.57% 0.67%] | [0.83% 0.95%] | [1.07% 1.20%] |
| M≥8 | 2.00E-5 (0.00%) | 7.00E-5 (0.01%) | 9.00E-5 (0.01%) | 1.10E-4 (0.01%) | 1.20E-4 (0.01%) | 1.50E-4 (0.01%) |
| 95% Conf | [0.00% 0.01%] | [0.00% 0.02%] | [0.00% 0.02%] | [0.01% 0.02%] | [0.01% 0.02%] | [0.01% 0.03%] |
Magnitude Number Distribution
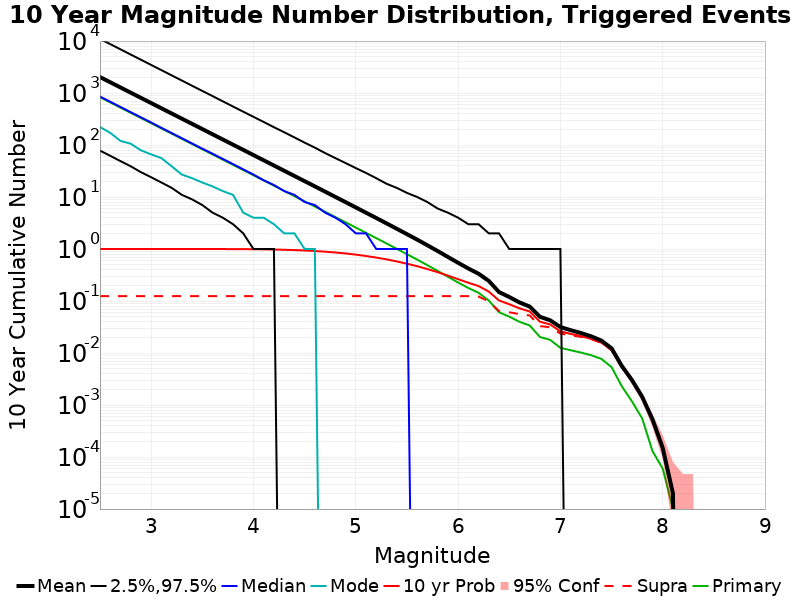
10 Year Magnitude Number Distribution
Legend
- Mean (thick black line): mean expected number across all 100000 catalogs
- 2.5%,97.5% (thin black lines): expected number percentiles across all 100000 catalogs
- Median (thin blue line): median expected number across all 100000 catalogs
- Mode (thin cyan line): modal expected number across all 100000 catalogs
- 10 yr Probability (thin red line): 10 year probability calculated as the fraction of catalogs with at least 1 occurrence
- 10 yr Supraseismogenic Probability (thin dashed red line): same as above, but only for supraseismogenic ruptures on explicitly modeled UCERF3 faults
- 95% Conf (light red shaded region): binomial 95% confidence bounds on probability
- Primary (thin green line): mean expected number from primary triggered aftershocks only (no secondary, tertiary, etc...) across all 100000 catalogs
| Mag | Mean | 2.5 %ile | 97.5 %ile | Median | Mode | 10 yr Probability | 10 yr Prob 95% Conf | 10 yr Supra-Seis Prob | Primary Aftershocks Mean |
|---|---|---|---|---|---|---|---|---|---|
| M≥2.5 | 2025.953 | 78.000 | 10964.000 | 854.000 | 222.000 | 1.000 (100.00%) | [100.00% 100.00%] | 0.124 (12.42%) | 829.356 |
| M≥2.6 | 1609.163 | 62.000 | 8711.000 | 679.000 | 171.000 | 1.000 (100.00%) | [100.00% 100.00%] | 0.124 (12.42%) | 658.688 |
| M≥2.7 | 1278.129 | 49.000 | 6920.000 | 539.000 | 120.000 | 1.000 (100.00%) | [100.00% 100.00%] | 0.124 (12.42%) | 523.193 |
| M≥2.8 | 1015.289 | 39.000 | 5489.000 | 428.000 | 106.000 | 1.000 (100.00%) | [100.00% 100.00%] | 0.124 (12.42%) | 415.572 |
| M≥2.9 | 806.434 | 30.000 | 4363.000 | 340.000 | 79.000 | 1.000 (100.00%) | [99.99% 100.00%] | 0.124 (12.42%) | 330.073 |
| M≥3 | 640.563 | 24.000 | 3464.000 | 271.000 | 66.000 | 1.000 (100.00%) | [99.99% 100.00%] | 0.124 (12.42%) | 262.212 |
| M≥3.1 | 508.791 | 19.000 | 2754.000 | 214.000 | 56.000 | 1.000 (100.00%) | [99.99% 100.00%] | 0.124 (12.42%) | 208.265 |
| M≥3.2 | 404.140 | 15.000 | 2187.000 | 170.000 | 39.000 | 1.000 (99.99%) | [99.98% 100.00%] | 0.124 (12.42%) | 165.418 |
| M≥3.3 | 320.969 | 11.000 | 1737.000 | 135.000 | 27.000 | 1.000 (99.98%) | [99.97% 99.99%] | 0.124 (12.42%) | 131.354 |
| M≥3.4 | 254.925 | 9.000 | 1378.000 | 107.000 | 23.000 | 1.000 (99.96%) | [99.95% 99.97%] | 0.124 (12.42%) | 104.324 |
| M≥3.5 | 202.484 | 7.000 | 1096.000 | 85.000 | 19.000 | 0.999 (99.93%) | [99.91% 99.95%] | 0.124 (12.42%) | 82.873 |
| M≥3.6 | 160.826 | 5.000 | 873.000 | 68.000 | 16.000 | 0.999 (99.87%) | [99.85% 99.89%] | 0.124 (12.42%) | 65.828 |
| M≥3.7 | 127.742 | 4.000 | 692.000 | 54.000 | 13.000 | 0.998 (99.77%) | [99.74% 99.80%] | 0.124 (12.42%) | 52.276 |
| M≥3.8 | 101.473 | 3.000 | 550.000 | 43.000 | 11.000 | 0.996 (99.61%) | [99.57% 99.65%] | 0.124 (12.42%) | 41.524 |
| M≥3.9 | 80.590 | 2.000 | 437.000 | 34.000 | 5.000 | 0.994 (99.36%) | [99.31% 99.41%] | 0.124 (12.42%) | 32.990 |
| M≥4 | 63.997 | 1.000 | 348.000 | 27.000 | 4.000 | 0.990 (99.00%) | [98.93% 99.06%] | 0.124 (12.42%) | 26.209 |
| M≥4.1 | 50.804 | 1.000 | 277.000 | 21.000 | 4.000 | 0.984 (98.45%) | [98.37% 98.52%] | 0.124 (12.42%) | 20.800 |
| M≥4.2 | 40.339 | 1.000 | 220.000 | 17.000 | 3.000 | 0.977 (97.69%) | [97.60% 97.78%] | 0.124 (12.42%) | 16.516 |
| M≥4.3 | 32.022 | 0.000 | 176.000 | 13.000 | 2.000 | 0.967 (96.69%) | [96.58% 96.80%] | 0.124 (12.42%) | 13.114 |
| M≥4.4 | 25.395 | 0.000 | 140.000 | 11.000 | 2.000 | 0.953 (95.33%) | [95.20% 95.46%] | 0.124 (12.42%) | 10.399 |
| M≥4.5 | 20.165 | 0.000 | 111.000 | 8.000 | 1.000 | 0.936 (93.60%) | [93.45% 93.75%] | 0.124 (12.42%) | 8.261 |
| M≥4.6 | 16.000 | 0.000 | 89.000 | 7.000 | 1.000 | 0.914 (91.38%) | [91.20% 91.55%] | 0.124 (12.42%) | 6.556 |
| M≥4.7 | 12.688 | 0.000 | 70.000 | 5.000 | 0.000 | 0.888 (88.80%) | [88.60% 88.99%] | 0.124 (12.42%) | 5.202 |
| M≥4.8 | 10.050 | 0.000 | 56.000 | 4.000 | 0.000 | 0.857 (85.67%) | [85.45% 85.89%] | 0.124 (12.42%) | 4.117 |
| M≥4.9 | 7.969 | 0.000 | 45.000 | 3.000 | 0.000 | 0.822 (82.16%) | [81.92% 82.40%] | 0.124 (12.42%) | 3.265 |
| M≥5 | 6.306 | 0.000 | 36.000 | 2.000 | 0.000 | 0.780 (77.98%) | [77.72% 78.23%] | 0.124 (12.42%) | 2.585 |
| M≥5.1 | 4.989 | 0.000 | 29.000 | 2.000 | 0.000 | 0.733 (73.33%) | [73.05% 73.60%] | 0.124 (12.42%) | 2.047 |
| M≥5.2 | 3.946 | 0.000 | 23.000 | 1.000 | 0.000 | 0.684 (68.41%) | [68.12% 68.70%] | 0.124 (12.42%) | 1.620 |
| M≥5.3 | 3.116 | 0.000 | 18.000 | 1.000 | 0.000 | 0.632 (63.22%) | [62.92% 63.52%] | 0.124 (12.42%) | 1.280 |
| M≥5.4 | 2.454 | 0.000 | 15.000 | 1.000 | 0.000 | 0.577 (57.68%) | [57.37% 57.98%] | 0.124 (12.42%) | 1.009 |
| M≥5.5 | 1.931 | 0.000 | 12.000 | 1.000 | 0.000 | 0.521 (52.14%) | [51.83% 52.45%] | 0.124 (12.42%) | 0.796 |
| M≥5.6 | 1.514 | 0.000 | 10.000 | 0.000 | 0.000 | 0.467 (46.66%) | [46.35% 46.97%] | 0.124 (12.42%) | 0.626 |
| M≥5.7 | 1.179 | 0.000 | 8.000 | 0.000 | 0.000 | 0.411 (41.13%) | [40.82% 41.43%] | 0.124 (12.42%) | 0.488 |
| M≥5.8 | 0.915 | 0.000 | 6.000 | 0.000 | 0.000 | 0.359 (35.85%) | [35.55% 36.15%] | 0.124 (12.42%) | 0.380 |
| M≥5.9 | 0.704 | 0.000 | 5.000 | 0.000 | 0.000 | 0.308 (30.82%) | [30.54% 31.11%] | 0.124 (12.42%) | 0.293 |
| M≥6 | 0.543 | 0.000 | 4.000 | 0.000 | 0.000 | 0.263 (26.29%) | [26.02% 26.56%] | 0.124 (12.42%) | 0.227 |
| M≥6.1 | 0.422 | 0.000 | 3.000 | 0.000 | 0.000 | 0.224 (22.43%) | [22.17% 22.69%] | 0.124 (12.39%) | 0.178 |
| M≥6.2 | 0.335 | 0.000 | 3.000 | 0.000 | 0.000 | 0.194 (19.40%) | [19.16% 19.65%] | 0.122 (12.17%) | 0.144 |
| M≥6.3 | 0.243 | 0.000 | 2.000 | 0.000 | 0.000 | 0.152 (15.17%) | [14.95% 15.39%] | 0.098 (9.82%) | 0.102 |
| M≥6.4 | 0.149 | 0.000 | 2.000 | 0.000 | 0.000 | 0.102 (10.24%) | [10.05% 10.43%] | 0.064 (6.41%) | 0.061 |
| M≥6.5 | 0.119 | 0.000 | 1.000 | 0.000 | 0.000 | 0.087 (8.68%) | [8.51% 8.86%] | 0.061 (6.07%) | 0.050 |
| M≥6.6 | 0.094 | 0.000 | 1.000 | 0.000 | 0.000 | 0.072 (7.23%) | [7.07% 7.39%] | 0.056 (5.59%) | 0.040 |
| M≥6.7 | 0.078 | 0.000 | 1.000 | 0.000 | 0.000 | 0.063 (6.29%) | [6.14% 6.44%] | 0.053 (5.27%) | 0.034 |
| M≥6.8 | 0.050 | 0.000 | 1.000 | 0.000 | 0.000 | 0.040 (4.00%) | [3.88% 4.12%] | 0.033 (3.28%) | 0.020 |
| M≥6.9 | 0.043 | 0.000 | 1.000 | 0.000 | 0.000 | 0.035 (3.54%) | [3.42% 3.65%] | 0.031 (3.13%) | 0.018 |
| M≥7 | 0.032 | 0.000 | 1.000 | 0.000 | 0.000 | 0.026 (2.61%) | [2.51% 2.71%] | 0.024 (2.36%) | 0.013 |
| M≥7.1 | 0.027 | 0.000 | 0.000 | 0.000 | 0.000 | 0.023 (2.33%) | [2.23% 2.42%] | 0.022 (2.19%) | 0.011 |
| M≥7.2 | 0.024 | 0.000 | 0.000 | 0.000 | 0.000 | 0.021 (2.12%) | [2.03% 2.21%] | 0.020 (2.04%) | 0.010 |
| M≥7.3 | 0.021 | 0.000 | 0.000 | 0.000 | 0.000 | 0.019 (1.87%) | [1.79% 1.96%] | 0.018 (1.84%) | 9.08E-3 |
| M≥7.4 | 0.017 | 0.000 | 0.000 | 0.000 | 0.000 | 0.016 (1.59%) | [1.52% 1.68%] | 0.016 (1.58%) | 7.72E-3 |
| M≥7.5 | 0.012 | 0.000 | 0.000 | 0.000 | 0.000 | 0.011 (1.13%) | [1.07% 1.20%] | 0.011 (1.13%) | 5.36E-3 |
| M≥7.6 | 5.65E-3 | 0.000 | 0.000 | 0.000 | 0.000 | 5.35E-3 (0.53%) | [0.49% 0.58%] | 5.33E-3 (0.53%) | 2.30E-3 |
| M≥7.7 | 3.01E-3 | 0.000 | 0.000 | 0.000 | 0.000 | 2.91E-3 (0.29%) | [0.26% 0.33%] | 2.90E-3 (0.29%) | 1.17E-3 |
| M≥7.8 | 1.43E-3 | 0.000 | 0.000 | 0.000 | 0.000 | 1.41E-3 (0.14%) | [0.12% 0.17%] | 1.40E-3 (0.14%) | 5.50E-4 |
| M≥7.9 | 5.30E-4 | 0.000 | 0.000 | 0.000 | 0.000 | 5.30E-4 (0.05%) | [0.04% 0.07%] | 5.30E-4 (0.05%) | 1.30E-4 |
| M≥8 | 1.50E-4 | 0.000 | 0.000 | 0.000 | 0.000 | 1.50E-4 (0.01%) | [0.01% 0.03%] | 1.50E-4 (0.01%) | 6.00E-5 |
| M≥8.1 | 2.00E-5 | 0.000 | 0.000 | 0.000 | 0.000 | 2.00E-5 (0.00%) | [0.00% 0.01%] | 2.00E-5 (0.00%) | 1.00E-5 |
| M≥8.2 | 0.000 | 0.000 | 0.000 | 0.000 | 0.000 | 0.000 (0.00%) | [0.00% 0.00%] | 0.000 (0.00%) | 0.000 |
| M≥8.3 | 0.000 | 0.000 | 0.000 | 0.000 | 0.000 | 0.000 (0.00%) | [0.00% 0.00%] | 0.000 (0.00%) | 0.000 |
| M≥8.4 | 0.000 | 0.000 | 0.000 | 0.000 | 0.000 | 0.000 (0.00%) | [0.00% 0.00%] | 0.000 (0.00%) | 0.000 |
| M≥8.5 | 0.000 | 0.000 | 0.000 | 0.000 | 0.000 | 0.000 (0.00%) | [0.00% 0.00%] | 0.000 (0.00%) | 0.000 |
| M≥8.6 | 0.000 | 0.000 | 0.000 | 0.000 | 0.000 | 0.000 (0.00%) | [0.00% 0.00%] | 0.000 (0.00%) | 0.000 |
| M≥8.7 | 0.000 | 0.000 | 0.000 | 0.000 | 0.000 | 0.000 (0.00%) | [0.00% 0.00%] | 0.000 (0.00%) | 0.000 |
| M≥8.8 | 0.000 | 0.000 | 0.000 | 0.000 | 0.000 | 0.000 (0.00%) | [0.00% 0.00%] | 0.000 (0.00%) | 0.000 |
| M≥8.9 | 0.000 | 0.000 | 0.000 | 0.000 | 0.000 | 0.000 (0.00%) | [0.00% 0.00%] | 0.000 (0.00%) | 0.000 |
| M≥9 | 0.000 | 0.000 | 0.000 | 0.000 | 0.000 | 0.000 (0.00%) | [0.00% 0.00%] | 0.000 (0.00%) | 0.000 |
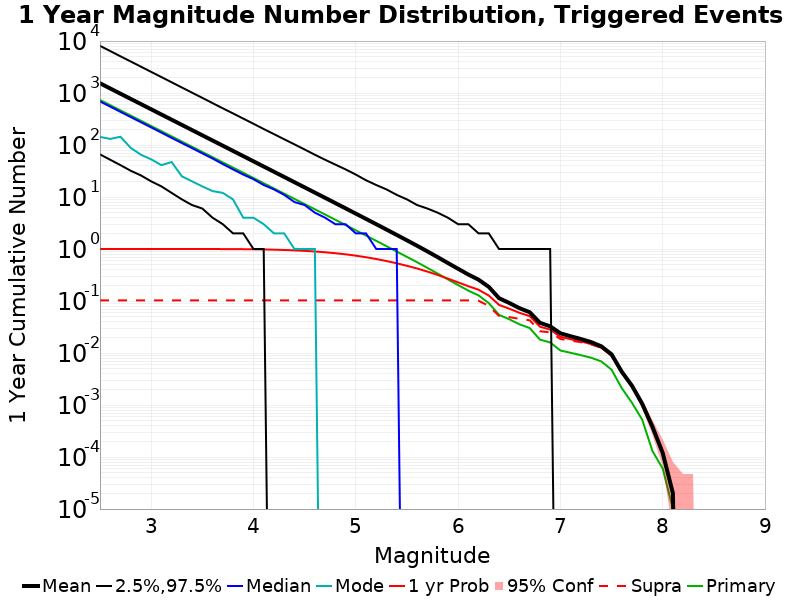
1 Year Magnitude Number Distribution
Legend
- Mean (thick black line): mean expected number across all 100000 catalogs
- 2.5%,97.5% (thin black lines): expected number percentiles across all 100000 catalogs
- Median (thin blue line): median expected number across all 100000 catalogs
- Mode (thin cyan line): modal expected number across all 100000 catalogs
- 1 yr Probability (thin red line): 1 year probability calculated as the fraction of catalogs with at least 1 occurrence
- 1 yr Supraseismogenic Probability (thin dashed red line): same as above, but only for supraseismogenic ruptures on explicitly modeled UCERF3 faults
- 95% Conf (light red shaded region): binomial 95% confidence bounds on probability
- Primary (thin green line): mean expected number from primary triggered aftershocks only (no secondary, tertiary, etc...) across all 100000 catalogs
| Mag | Mean | 2.5 %ile | 97.5 %ile | Median | Mode | 1 yr Probability | 1 yr Prob 95% Conf | 1 yr Supra-Seis Prob | Primary Aftershocks Mean |
|---|---|---|---|---|---|---|---|---|---|
| M≥2.5 | 1537.328 | 66.000 | 8063.000 | 688.000 | 143.000 | 1.000 (100.00%) | [100.00% 100.00%] | 0.103 (10.30%) | 734.238 |
| M≥2.6 | 1221.055 | 52.000 | 6406.000 | 547.000 | 131.000 | 1.000 (100.00%) | [100.00% 100.00%] | 0.103 (10.30%) | 583.140 |
| M≥2.7 | 969.869 | 41.000 | 5077.000 | 434.000 | 144.000 | 1.000 (100.00%) | [100.00% 100.00%] | 0.103 (10.30%) | 463.189 |
| M≥2.8 | 770.425 | 32.000 | 4040.000 | 345.000 | 88.000 | 1.000 (100.00%) | [100.00% 100.00%] | 0.103 (10.30%) | 367.921 |
| M≥2.9 | 611.932 | 26.000 | 3209.000 | 274.000 | 65.000 | 1.000 (100.00%) | [99.99% 100.00%] | 0.103 (10.30%) | 292.221 |
| M≥3 | 486.082 | 20.000 | 2547.000 | 218.000 | 53.000 | 1.000 (100.00%) | [99.99% 100.00%] | 0.103 (10.30%) | 232.147 |
| M≥3.1 | 386.112 | 16.000 | 2025.000 | 173.000 | 41.000 | 1.000 (99.99%) | [99.99% 100.00%] | 0.103 (10.30%) | 184.392 |
| M≥3.2 | 306.710 | 12.000 | 1608.000 | 137.000 | 47.000 | 1.000 (99.99%) | [99.98% 99.99%] | 0.103 (10.30%) | 146.461 |
| M≥3.3 | 243.606 | 9.000 | 1276.000 | 109.000 | 25.000 | 1.000 (99.97%) | [99.96% 99.98%] | 0.103 (10.30%) | 116.305 |
| M≥3.4 | 193.477 | 7.000 | 1014.000 | 87.000 | 20.000 | 0.999 (99.94%) | [99.93% 99.96%] | 0.103 (10.30%) | 92.373 |
| M≥3.5 | 153.667 | 6.000 | 807.000 | 69.000 | 16.000 | 0.999 (99.90%) | [99.88% 99.92%] | 0.103 (10.30%) | 73.376 |
| M≥3.6 | 122.058 | 4.000 | 639.000 | 55.000 | 13.000 | 0.998 (99.82%) | [99.79% 99.84%] | 0.103 (10.30%) | 58.286 |
| M≥3.7 | 96.950 | 3.000 | 508.000 | 43.000 | 12.000 | 0.997 (99.69%) | [99.65% 99.72%] | 0.103 (10.30%) | 46.289 |
| M≥3.8 | 77.020 | 2.000 | 405.000 | 34.000 | 9.000 | 0.995 (99.48%) | [99.44% 99.53%] | 0.103 (10.30%) | 36.769 |
| M≥3.9 | 61.168 | 2.000 | 322.000 | 27.000 | 4.000 | 0.992 (99.18%) | [99.12% 99.23%] | 0.103 (10.30%) | 29.213 |
| M≥4 | 48.578 | 1.000 | 256.000 | 22.000 | 4.000 | 0.987 (98.70%) | [98.63% 98.77%] | 0.103 (10.30%) | 23.206 |
| M≥4.1 | 38.560 | 1.000 | 203.000 | 17.000 | 3.000 | 0.980 (98.01%) | [97.92% 98.10%] | 0.103 (10.30%) | 18.415 |
| M≥4.2 | 30.617 | 0.000 | 162.000 | 14.000 | 2.000 | 0.971 (97.06%) | [96.95% 97.16%] | 0.103 (10.30%) | 14.621 |
| M≥4.3 | 24.313 | 0.000 | 129.000 | 11.000 | 2.000 | 0.958 (95.84%) | [95.71% 95.96%] | 0.103 (10.30%) | 11.611 |
| M≥4.4 | 19.278 | 0.000 | 103.000 | 8.000 | 1.000 | 0.942 (94.18%) | [94.03% 94.33%] | 0.103 (10.30%) | 9.207 |
| M≥4.5 | 15.311 | 0.000 | 82.000 | 7.000 | 1.000 | 0.921 (92.11%) | [91.94% 92.27%] | 0.103 (10.30%) | 7.314 |
| M≥4.6 | 12.153 | 0.000 | 65.000 | 5.000 | 1.000 | 0.895 (89.53%) | [89.34% 89.72%] | 0.103 (10.30%) | 5.806 |
| M≥4.7 | 9.642 | 0.000 | 52.000 | 4.000 | 0.000 | 0.866 (86.59%) | [86.37% 86.80%] | 0.103 (10.30%) | 4.608 |
| M≥4.8 | 7.638 | 0.000 | 42.000 | 3.000 | 0.000 | 0.830 (83.02%) | [82.78% 83.25%] | 0.103 (10.30%) | 3.648 |
| M≥4.9 | 6.056 | 0.000 | 34.000 | 3.000 | 0.000 | 0.791 (79.06%) | [78.81% 79.31%] | 0.103 (10.30%) | 2.894 |
| M≥5 | 4.791 | 0.000 | 27.000 | 2.000 | 0.000 | 0.744 (74.45%) | [74.18% 74.72%] | 0.103 (10.30%) | 2.289 |
| M≥5.1 | 3.791 | 0.000 | 21.000 | 2.000 | 0.000 | 0.695 (69.46%) | [69.17% 69.75%] | 0.103 (10.30%) | 1.813 |
| M≥5.2 | 2.999 | 0.000 | 17.000 | 1.000 | 0.000 | 0.642 (64.18%) | [63.88% 64.48%] | 0.103 (10.30%) | 1.436 |
| M≥5.3 | 2.368 | 0.000 | 14.000 | 1.000 | 0.000 | 0.587 (58.68%) | [58.37% 58.98%] | 0.103 (10.30%) | 1.134 |
| M≥5.4 | 1.865 | 0.000 | 11.000 | 1.000 | 0.000 | 0.531 (53.11%) | [52.80% 53.42%] | 0.103 (10.30%) | 0.895 |
| M≥5.5 | 1.469 | 0.000 | 9.000 | 0.000 | 0.000 | 0.475 (47.55%) | [47.24% 47.86%] | 0.103 (10.30%) | 0.706 |
| M≥5.6 | 1.153 | 0.000 | 7.000 | 0.000 | 0.000 | 0.422 (42.18%) | [41.87% 42.48%] | 0.103 (10.30%) | 0.556 |
| M≥5.7 | 0.899 | 0.000 | 6.000 | 0.000 | 0.000 | 0.368 (36.76%) | [36.46% 37.06%] | 0.103 (10.30%) | 0.434 |
| M≥5.8 | 0.698 | 0.000 | 5.000 | 0.000 | 0.000 | 0.317 (31.71%) | [31.42% 32.00%] | 0.103 (10.30%) | 0.337 |
| M≥5.9 | 0.538 | 0.000 | 4.000 | 0.000 | 0.000 | 0.270 (26.97%) | [26.70% 27.25%] | 0.103 (10.30%) | 0.261 |
| M≥6 | 0.416 | 0.000 | 3.000 | 0.000 | 0.000 | 0.228 (22.83%) | [22.57% 23.09%] | 0.103 (10.30%) | 0.203 |
| M≥6.1 | 0.323 | 0.000 | 3.000 | 0.000 | 0.000 | 0.193 (19.26%) | [19.01% 19.50%] | 0.103 (10.28%) | 0.158 |
| M≥6.2 | 0.257 | 0.000 | 2.000 | 0.000 | 0.000 | 0.165 (16.47%) | [16.24% 16.70%] | 0.101 (10.11%) | 0.128 |
| M≥6.3 | 0.187 | 0.000 | 2.000 | 0.000 | 0.000 | 0.127 (12.73%) | [12.53% 12.94%] | 0.080 (8.05%) | 0.091 |
| M≥6.4 | 0.113 | 0.000 | 1.000 | 0.000 | 0.000 | 0.084 (8.42%) | [8.25% 8.59%] | 0.052 (5.17%) | 0.054 |
| M≥6.5 | 0.092 | 0.000 | 1.000 | 0.000 | 0.000 | 0.071 (7.11%) | [6.95% 7.27%] | 0.049 (4.91%) | 0.045 |
| M≥6.6 | 0.073 | 0.000 | 1.000 | 0.000 | 0.000 | 0.059 (5.92%) | [5.78% 6.07%] | 0.045 (4.53%) | 0.036 |
| M≥6.7 | 0.061 | 0.000 | 1.000 | 0.000 | 0.000 | 0.051 (5.12%) | [4.98% 5.26%] | 0.043 (4.26%) | 0.030 |
| M≥6.8 | 0.038 | 0.000 | 1.000 | 0.000 | 0.000 | 0.032 (3.21%) | [3.10% 3.32%] | 0.026 (2.62%) | 0.018 |
| M≥6.9 | 0.033 | 0.000 | 1.000 | 0.000 | 0.000 | 0.028 (2.82%) | [2.71% 2.92%] | 0.025 (2.49%) | 0.016 |
| M≥7 | 0.024 | 0.000 | 0.000 | 0.000 | 0.000 | 0.021 (2.05%) | [1.97% 2.15%] | 0.019 (1.86%) | 0.011 |
| M≥7.1 | 0.021 | 0.000 | 0.000 | 0.000 | 0.000 | 0.018 (1.84%) | [1.76% 1.93%] | 0.017 (1.73%) | 0.010 |
| M≥7.2 | 0.019 | 0.000 | 0.000 | 0.000 | 0.000 | 0.017 (1.68%) | [1.60% 1.76%] | 0.016 (1.62%) | 9.09E-3 |
| M≥7.3 | 0.016 | 0.000 | 0.000 | 0.000 | 0.000 | 0.015 (1.49%) | [1.41% 1.56%] | 0.015 (1.46%) | 8.11E-3 |
| M≥7.4 | 0.013 | 0.000 | 0.000 | 0.000 | 0.000 | 0.013 (1.27%) | [1.20% 1.34%] | 0.013 (1.26%) | 6.89E-3 |
| M≥7.5 | 9.43E-3 | 0.000 | 0.000 | 0.000 | 0.000 | 8.89E-3 (0.89%) | [0.83% 0.95%] | 8.88E-3 (0.89%) | 4.78E-3 |
| M≥7.6 | 4.36E-3 | 0.000 | 0.000 | 0.000 | 0.000 | 4.18E-3 (0.42%) | [0.38% 0.46%] | 4.17E-3 (0.42%) | 2.11E-3 |
| M≥7.7 | 2.34E-3 | 0.000 | 0.000 | 0.000 | 0.000 | 2.28E-3 (0.23%) | [0.20% 0.26%] | 2.28E-3 (0.23%) | 1.10E-3 |
| M≥7.8 | 1.05E-3 | 0.000 | 0.000 | 0.000 | 0.000 | 1.05E-3 (0.10%) | [0.09% 0.13%] | 1.05E-3 (0.10%) | 5.20E-4 |
| M≥7.9 | 3.80E-4 | 0.000 | 0.000 | 0.000 | 0.000 | 3.80E-4 (0.04%) | [0.03% 0.05%] | 3.80E-4 (0.04%) | 1.30E-4 |
| M≥8 | 1.20E-4 | 0.000 | 0.000 | 0.000 | 0.000 | 1.20E-4 (0.01%) | [0.01% 0.02%] | 1.20E-4 (0.01%) | 6.00E-5 |
| M≥8.1 | 2.00E-5 | 0.000 | 0.000 | 0.000 | 0.000 | 2.00E-5 (0.00%) | [0.00% 0.01%] | 2.00E-5 (0.00%) | 1.00E-5 |
| M≥8.2 | 0.000 | 0.000 | 0.000 | 0.000 | 0.000 | 0.000 (0.00%) | [0.00% 0.00%] | 0.000 (0.00%) | 0.000 |
| M≥8.3 | 0.000 | 0.000 | 0.000 | 0.000 | 0.000 | 0.000 (0.00%) | [0.00% 0.00%] | 0.000 (0.00%) | 0.000 |
| M≥8.4 | 0.000 | 0.000 | 0.000 | 0.000 | 0.000 | 0.000 (0.00%) | [0.00% 0.00%] | 0.000 (0.00%) | 0.000 |
| M≥8.5 | 0.000 | 0.000 | 0.000 | 0.000 | 0.000 | 0.000 (0.00%) | [0.00% 0.00%] | 0.000 (0.00%) | 0.000 |
| M≥8.6 | 0.000 | 0.000 | 0.000 | 0.000 | 0.000 | 0.000 (0.00%) | [0.00% 0.00%] | 0.000 (0.00%) | 0.000 |
| M≥8.7 | 0.000 | 0.000 | 0.000 | 0.000 | 0.000 | 0.000 (0.00%) | [0.00% 0.00%] | 0.000 (0.00%) | 0.000 |
| M≥8.8 | 0.000 | 0.000 | 0.000 | 0.000 | 0.000 | 0.000 (0.00%) | [0.00% 0.00%] | 0.000 (0.00%) | 0.000 |
| M≥8.9 | 0.000 | 0.000 | 0.000 | 0.000 | 0.000 | 0.000 (0.00%) | [0.00% 0.00%] | 0.000 (0.00%) | 0.000 |
| M≥9 | 0.000 | 0.000 | 0.000 | 0.000 | 0.000 | 0.000 (0.00%) | [0.00% 0.00%] | 0.000 (0.00%) | 0.000 |
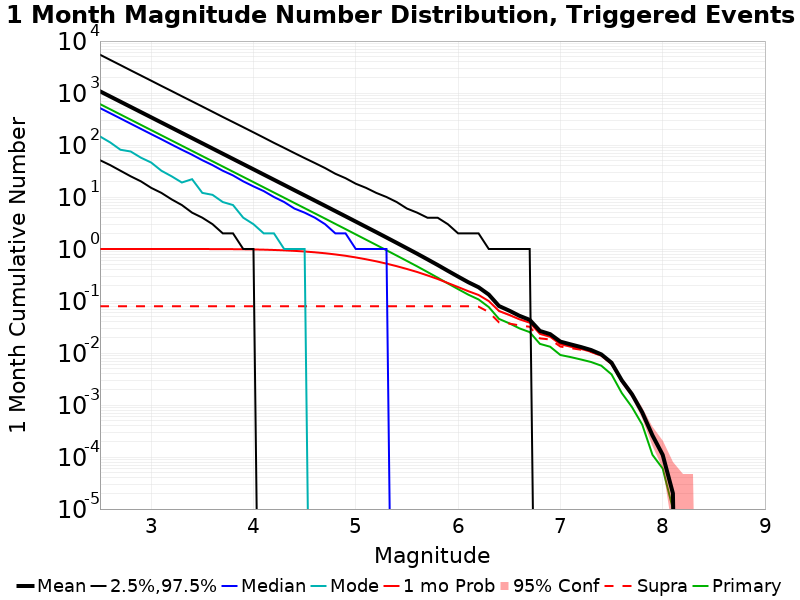
1 Month Magnitude Number Distribution
Legend
- Mean (thick black line): mean expected number across all 100000 catalogs
- 2.5%,97.5% (thin black lines): expected number percentiles across all 100000 catalogs
- Median (thin blue line): median expected number across all 100000 catalogs
- Mode (thin cyan line): modal expected number across all 100000 catalogs
- 1 mo Probability (thin red line): 1 month probability calculated as the fraction of catalogs with at least 1 occurrence
- 1 mo Supraseismogenic Probability (thin dashed red line): same as above, but only for supraseismogenic ruptures on explicitly modeled UCERF3 faults
- 95% Conf (light red shaded region): binomial 95% confidence bounds on probability
- Primary (thin green line): mean expected number from primary triggered aftershocks only (no secondary, tertiary, etc...) across all 100000 catalogs
| Mag | Mean | 2.5 %ile | 97.5 %ile | Median | Mode | 1 mo Probability | 1 mo Prob 95% Conf | 1 mo Supra-Seis Prob | Primary Aftershocks Mean |
|---|---|---|---|---|---|---|---|---|---|
| M≥2.5 | 1077.791 | 51.000 | 5450.000 | 513.000 | 146.000 | 1.000 (100.00%) | [100.00% 100.00%] | 0.079 (7.93%) | 612.067 |
| M≥2.6 | 856.055 | 41.000 | 4327.000 | 408.000 | 112.000 | 1.000 (100.00%) | [100.00% 100.00%] | 0.079 (7.93%) | 486.112 |
| M≥2.7 | 679.961 | 32.000 | 3439.000 | 324.000 | 81.000 | 1.000 (100.00%) | [100.00% 100.00%] | 0.079 (7.93%) | 386.125 |
| M≥2.8 | 540.152 | 25.000 | 2727.000 | 257.000 | 75.000 | 1.000 (100.00%) | [99.99% 100.00%] | 0.079 (7.93%) | 306.701 |
| M≥2.9 | 429.007 | 20.000 | 2170.000 | 204.000 | 57.000 | 1.000 (100.00%) | [99.99% 100.00%] | 0.079 (7.93%) | 243.590 |
| M≥3 | 340.787 | 15.000 | 1725.000 | 162.000 | 46.000 | 1.000 (99.99%) | [99.98% 100.00%] | 0.079 (7.93%) | 193.511 |
| M≥3.1 | 270.690 | 12.000 | 1369.000 | 129.000 | 32.000 | 1.000 (99.99%) | [99.98% 99.99%] | 0.079 (7.93%) | 153.696 |
| M≥3.2 | 215.034 | 9.000 | 1091.000 | 102.000 | 25.000 | 1.000 (99.97%) | [99.96% 99.98%] | 0.079 (7.93%) | 122.083 |
| M≥3.3 | 170.788 | 7.000 | 866.000 | 81.000 | 19.000 | 0.999 (99.95%) | [99.93% 99.96%] | 0.079 (7.93%) | 96.945 |
| M≥3.4 | 135.656 | 5.000 | 690.000 | 65.000 | 22.000 | 0.999 (99.90%) | [99.87% 99.92%] | 0.079 (7.93%) | 77.000 |
| M≥3.5 | 107.737 | 4.000 | 549.000 | 51.000 | 12.000 | 0.998 (99.81%) | [99.78% 99.84%] | 0.079 (7.93%) | 61.164 |
| M≥3.6 | 85.576 | 3.000 | 436.000 | 41.000 | 11.000 | 0.997 (99.68%) | [99.64% 99.72%] | 0.079 (7.93%) | 48.588 |
| M≥3.7 | 67.969 | 2.000 | 346.000 | 32.000 | 8.000 | 0.995 (99.48%) | [99.44% 99.53%] | 0.079 (7.93%) | 38.587 |
| M≥3.8 | 53.991 | 2.000 | 276.000 | 26.000 | 7.000 | 0.992 (99.18%) | [99.12% 99.23%] | 0.079 (7.93%) | 30.651 |
| M≥3.9 | 42.885 | 1.000 | 220.000 | 20.000 | 4.000 | 0.987 (98.73%) | [98.66% 98.80%] | 0.079 (7.93%) | 24.351 |
| M≥4 | 34.066 | 1.000 | 175.000 | 16.000 | 3.000 | 0.980 (98.03%) | [97.95% 98.12%] | 0.079 (7.93%) | 19.343 |
| M≥4.1 | 27.045 | 0.000 | 139.000 | 13.000 | 2.000 | 0.971 (97.08%) | [96.97% 97.18%] | 0.079 (7.93%) | 15.353 |
| M≥4.2 | 21.469 | 0.000 | 110.000 | 10.000 | 2.000 | 0.958 (95.79%) | [95.66% 95.91%] | 0.079 (7.93%) | 12.189 |
| M≥4.3 | 17.054 | 0.000 | 88.000 | 8.000 | 1.000 | 0.942 (94.19%) | [94.05% 94.34%] | 0.079 (7.93%) | 9.681 |
| M≥4.4 | 13.521 | 0.000 | 70.000 | 6.000 | 1.000 | 0.921 (92.08%) | [91.91% 92.25%] | 0.079 (7.93%) | 7.676 |
| M≥4.5 | 10.743 | 0.000 | 56.000 | 5.000 | 1.000 | 0.895 (89.52%) | [89.32% 89.70%] | 0.079 (7.93%) | 6.097 |
| M≥4.6 | 8.527 | 0.000 | 45.000 | 4.000 | 0.000 | 0.864 (86.37%) | [86.15% 86.58%] | 0.079 (7.93%) | 4.840 |
| M≥4.7 | 6.770 | 0.000 | 36.000 | 3.000 | 0.000 | 0.828 (82.80%) | [82.57% 83.04%] | 0.079 (7.93%) | 3.843 |
| M≥4.8 | 5.362 | 0.000 | 28.000 | 2.000 | 0.000 | 0.786 (78.59%) | [78.34% 78.85%] | 0.079 (7.93%) | 3.042 |
| M≥4.9 | 4.253 | 0.000 | 23.000 | 2.000 | 0.000 | 0.741 (74.07%) | [73.79% 74.34%] | 0.079 (7.93%) | 2.413 |
| M≥5 | 3.364 | 0.000 | 18.000 | 1.000 | 0.000 | 0.689 (68.87%) | [68.58% 69.15%] | 0.079 (7.93%) | 1.910 |
| M≥5.1 | 2.663 | 0.000 | 15.000 | 1.000 | 0.000 | 0.634 (63.44%) | [63.14% 63.74%] | 0.079 (7.93%) | 1.511 |
| M≥5.2 | 2.109 | 0.000 | 12.000 | 1.000 | 0.000 | 0.580 (57.98%) | [57.67% 58.29%] | 0.079 (7.93%) | 1.198 |
| M≥5.3 | 1.664 | 0.000 | 10.000 | 1.000 | 0.000 | 0.523 (52.33%) | [52.02% 52.64%] | 0.079 (7.93%) | 0.946 |
| M≥5.4 | 1.312 | 0.000 | 8.000 | 0.000 | 0.000 | 0.467 (46.73%) | [46.42% 47.04%] | 0.079 (7.93%) | 0.747 |
| M≥5.5 | 1.032 | 0.000 | 6.000 | 0.000 | 0.000 | 0.413 (41.26%) | [40.96% 41.57%] | 0.079 (7.93%) | 0.589 |
| M≥5.6 | 0.812 | 0.000 | 5.000 | 0.000 | 0.000 | 0.361 (36.13%) | [35.83% 36.43%] | 0.079 (7.93%) | 0.463 |
| M≥5.7 | 0.633 | 0.000 | 4.000 | 0.000 | 0.000 | 0.311 (31.09%) | [30.80% 31.38%] | 0.079 (7.93%) | 0.361 |
| M≥5.8 | 0.493 | 0.000 | 4.000 | 0.000 | 0.000 | 0.265 (26.50%) | [26.23% 26.78%] | 0.079 (7.93%) | 0.281 |
| M≥5.9 | 0.380 | 0.000 | 3.000 | 0.000 | 0.000 | 0.222 (22.19%) | [21.93% 22.45%] | 0.079 (7.93%) | 0.217 |
| M≥6 | 0.295 | 0.000 | 2.000 | 0.000 | 0.000 | 0.185 (18.55%) | [18.31% 18.79%] | 0.079 (7.93%) | 0.169 |
| M≥6.1 | 0.229 | 0.000 | 2.000 | 0.000 | 0.000 | 0.154 (15.44%) | [15.22% 15.67%] | 0.079 (7.91%) | 0.132 |
| M≥6.2 | 0.184 | 0.000 | 2.000 | 0.000 | 0.000 | 0.131 (13.06%) | [12.86% 13.27%] | 0.078 (7.78%) | 0.107 |
| M≥6.3 | 0.133 | 0.000 | 1.000 | 0.000 | 0.000 | 0.100 (9.96%) | [9.78% 10.15%] | 0.061 (6.14%) | 0.076 |
| M≥6.4 | 0.080 | 0.000 | 1.000 | 0.000 | 0.000 | 0.064 (6.42%) | [6.27% 6.58%] | 0.039 (3.87%) | 0.045 |
| M≥6.5 | 0.065 | 0.000 | 1.000 | 0.000 | 0.000 | 0.054 (5.40%) | [5.26% 5.54%] | 0.037 (3.68%) | 0.037 |
| M≥6.6 | 0.052 | 0.000 | 1.000 | 0.000 | 0.000 | 0.044 (4.45%) | [4.32% 4.58%] | 0.034 (3.39%) | 0.030 |
| M≥6.7 | 0.043 | 0.000 | 1.000 | 0.000 | 0.000 | 0.038 (3.83%) | [3.71% 3.95%] | 0.032 (3.19%) | 0.025 |
| M≥6.8 | 0.027 | 0.000 | 0.000 | 0.000 | 0.000 | 0.023 (2.34%) | [2.25% 2.44%] | 0.019 (1.91%) | 0.015 |
| M≥6.9 | 0.023 | 0.000 | 0.000 | 0.000 | 0.000 | 0.021 (2.06%) | [1.98% 2.15%] | 0.018 (1.82%) | 0.013 |
| M≥7 | 0.017 | 0.000 | 0.000 | 0.000 | 0.000 | 0.015 (1.48%) | [1.40% 1.55%] | 0.013 (1.33%) | 9.15E-3 |
| M≥7.1 | 0.015 | 0.000 | 0.000 | 0.000 | 0.000 | 0.013 (1.33%) | [1.26% 1.40%] | 0.012 (1.24%) | 8.34E-3 |
| M≥7.2 | 0.013 | 0.000 | 0.000 | 0.000 | 0.000 | 0.012 (1.21%) | [1.14% 1.28%] | 0.012 (1.16%) | 7.51E-3 |
| M≥7.3 | 0.011 | 0.000 | 0.000 | 0.000 | 0.000 | 0.011 (1.06%) | [1.00% 1.13%] | 0.010 (1.05%) | 6.71E-3 |
| M≥7.4 | 9.40E-3 | 0.000 | 0.000 | 0.000 | 0.000 | 8.98E-3 (0.90%) | [0.84% 0.96%] | 8.93E-3 (0.89%) | 5.70E-3 |
| M≥7.5 | 6.50E-3 | 0.000 | 0.000 | 0.000 | 0.000 | 6.19E-3 (0.62%) | [0.57% 0.67%] | 6.19E-3 (0.62%) | 3.88E-3 |
| M≥7.6 | 2.98E-3 | 0.000 | 0.000 | 0.000 | 0.000 | 2.88E-3 (0.29%) | [0.26% 0.32%] | 2.88E-3 (0.29%) | 1.70E-3 |
| M≥7.7 | 1.61E-3 | 0.000 | 0.000 | 0.000 | 0.000 | 1.57E-3 (0.16%) | [0.13% 0.18%] | 1.57E-3 (0.16%) | 9.10E-4 |
| M≥7.8 | 7.20E-4 | 0.000 | 0.000 | 0.000 | 0.000 | 7.20E-4 (0.07%) | [0.06% 0.09%] | 7.20E-4 (0.07%) | 4.20E-4 |
| M≥7.9 | 2.60E-4 | 0.000 | 0.000 | 0.000 | 0.000 | 2.60E-4 (0.03%) | [0.02% 0.04%] | 2.60E-4 (0.03%) | 1.10E-4 |
| M≥8 | 1.10E-4 | 0.000 | 0.000 | 0.000 | 0.000 | 1.10E-4 (0.01%) | [0.01% 0.02%] | 1.10E-4 (0.01%) | 6.00E-5 |
| M≥8.1 | 2.00E-5 | 0.000 | 0.000 | 0.000 | 0.000 | 2.00E-5 (0.00%) | [0.00% 0.01%] | 2.00E-5 (0.00%) | 1.00E-5 |
| M≥8.2 | 0.000 | 0.000 | 0.000 | 0.000 | 0.000 | 0.000 (0.00%) | [0.00% 0.00%] | 0.000 (0.00%) | 0.000 |
| M≥8.3 | 0.000 | 0.000 | 0.000 | 0.000 | 0.000 | 0.000 (0.00%) | [0.00% 0.00%] | 0.000 (0.00%) | 0.000 |
| M≥8.4 | 0.000 | 0.000 | 0.000 | 0.000 | 0.000 | 0.000 (0.00%) | [0.00% 0.00%] | 0.000 (0.00%) | 0.000 |
| M≥8.5 | 0.000 | 0.000 | 0.000 | 0.000 | 0.000 | 0.000 (0.00%) | [0.00% 0.00%] | 0.000 (0.00%) | 0.000 |
| M≥8.6 | 0.000 | 0.000 | 0.000 | 0.000 | 0.000 | 0.000 (0.00%) | [0.00% 0.00%] | 0.000 (0.00%) | 0.000 |
| M≥8.7 | 0.000 | 0.000 | 0.000 | 0.000 | 0.000 | 0.000 (0.00%) | [0.00% 0.00%] | 0.000 (0.00%) | 0.000 |
| M≥8.8 | 0.000 | 0.000 | 0.000 | 0.000 | 0.000 | 0.000 (0.00%) | [0.00% 0.00%] | 0.000 (0.00%) | 0.000 |
| M≥8.9 | 0.000 | 0.000 | 0.000 | 0.000 | 0.000 | 0.000 (0.00%) | [0.00% 0.00%] | 0.000 (0.00%) | 0.000 |
| M≥9 | 0.000 | 0.000 | 0.000 | 0.000 | 0.000 | 0.000 (0.00%) | [0.00% 0.00%] | 0.000 (0.00%) | 0.000 |
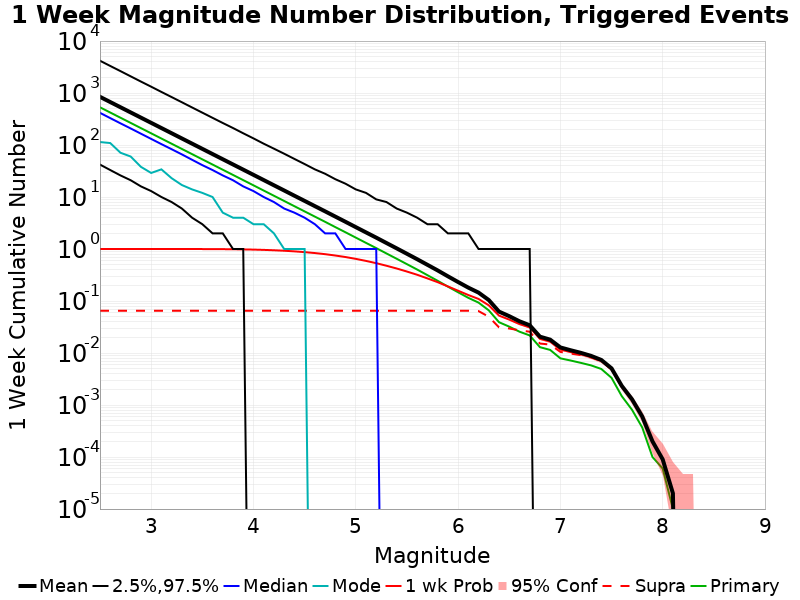
1 Week Magnitude Number Distribution
Legend
- Mean (thick black line): mean expected number across all 100000 catalogs
- 2.5%,97.5% (thin black lines): expected number percentiles across all 100000 catalogs
- Median (thin blue line): median expected number across all 100000 catalogs
- Mode (thin cyan line): modal expected number across all 100000 catalogs
- 1 wk Probability (thin red line): 1 week probability calculated as the fraction of catalogs with at least 1 occurrence
- 1 wk Supraseismogenic Probability (thin dashed red line): same as above, but only for supraseismogenic ruptures on explicitly modeled UCERF3 faults
- 95% Conf (light red shaded region): binomial 95% confidence bounds on probability
- Primary (thin green line): mean expected number from primary triggered aftershocks only (no secondary, tertiary, etc...) across all 100000 catalogs
| Mag | Mean | 2.5 %ile | 97.5 %ile | Median | Mode | 1 wk Probability | 1 wk Prob 95% Conf | 1 wk Supra-Seis Prob | Primary Aftershocks Mean |
|---|---|---|---|---|---|---|---|---|---|
| M≥2.5 | 843.663 | 42.000 | 4172.000 | 415.000 | 114.000 | 1.000 (100.00%) | [100.00% 100.00%] | 0.065 (6.51%) | 530.506 |
| M≥2.6 | 670.086 | 33.000 | 3312.000 | 329.000 | 109.000 | 1.000 (100.00%) | [99.99% 100.00%] | 0.065 (6.51%) | 421.343 |
| M≥2.7 | 532.261 | 26.000 | 2635.000 | 261.000 | 71.000 | 1.000 (100.00%) | [99.99% 100.00%] | 0.065 (6.51%) | 334.695 |
| M≥2.8 | 422.823 | 21.000 | 2090.000 | 208.000 | 60.000 | 1.000 (100.00%) | [99.99% 100.00%] | 0.065 (6.51%) | 265.854 |
| M≥2.9 | 335.821 | 16.000 | 1659.000 | 165.000 | 38.000 | 1.000 (99.99%) | [99.99% 100.00%] | 0.065 (6.51%) | 211.146 |
| M≥3 | 266.804 | 13.000 | 1322.000 | 131.000 | 29.000 | 1.000 (99.99%) | [99.98% 99.99%] | 0.065 (6.51%) | 167.753 |
| M≥3.1 | 211.921 | 10.000 | 1049.000 | 104.000 | 34.000 | 1.000 (99.98%) | [99.97% 99.99%] | 0.065 (6.51%) | 133.237 |
| M≥3.2 | 168.326 | 8.000 | 835.000 | 83.000 | 23.000 | 1.000 (99.96%) | [99.94% 99.97%] | 0.065 (6.51%) | 105.822 |
| M≥3.3 | 133.684 | 6.000 | 664.000 | 66.000 | 17.000 | 0.999 (99.92%) | [99.90% 99.93%] | 0.065 (6.51%) | 84.030 |
| M≥3.4 | 106.195 | 4.000 | 527.000 | 52.000 | 14.000 | 0.998 (99.84%) | [99.81% 99.86%] | 0.065 (6.51%) | 66.741 |
| M≥3.5 | 84.342 | 3.000 | 419.000 | 41.000 | 12.000 | 0.997 (99.72%) | [99.69% 99.76%] | 0.065 (6.51%) | 53.012 |
| M≥3.6 | 66.994 | 2.000 | 333.000 | 33.000 | 10.000 | 0.996 (99.55%) | [99.51% 99.59%] | 0.065 (6.51%) | 42.118 |
| M≥3.7 | 53.210 | 2.000 | 265.000 | 26.000 | 5.000 | 0.993 (99.27%) | [99.21% 99.32%] | 0.065 (6.51%) | 33.445 |
| M≥3.8 | 42.269 | 1.000 | 212.000 | 21.000 | 4.000 | 0.988 (98.85%) | [98.78% 98.91%] | 0.065 (6.51%) | 26.568 |
| M≥3.9 | 33.572 | 1.000 | 168.000 | 16.000 | 4.000 | 0.982 (98.25%) | [98.17% 98.33%] | 0.065 (6.51%) | 21.107 |
| M≥4 | 26.669 | 0.000 | 134.000 | 13.000 | 3.000 | 0.974 (97.37%) | [97.27% 97.47%] | 0.065 (6.51%) | 16.766 |
| M≥4.1 | 21.169 | 0.000 | 106.000 | 10.000 | 3.000 | 0.962 (96.16%) | [96.03% 96.27%] | 0.065 (6.51%) | 13.307 |
| M≥4.2 | 16.805 | 0.000 | 85.000 | 8.000 | 2.000 | 0.946 (94.55%) | [94.41% 94.69%] | 0.065 (6.51%) | 10.566 |
| M≥4.3 | 13.347 | 0.000 | 68.000 | 6.000 | 1.000 | 0.926 (92.58%) | [92.42% 92.75%] | 0.065 (6.51%) | 8.392 |
| M≥4.4 | 10.586 | 0.000 | 54.000 | 5.000 | 1.000 | 0.901 (90.09%) | [89.90% 90.27%] | 0.065 (6.51%) | 6.654 |
| M≥4.5 | 8.410 | 0.000 | 43.000 | 4.000 | 1.000 | 0.871 (87.08%) | [86.87% 87.28%] | 0.065 (6.51%) | 5.285 |
| M≥4.6 | 6.675 | 0.000 | 34.000 | 3.000 | 0.000 | 0.836 (83.58%) | [83.34% 83.80%] | 0.065 (6.51%) | 4.197 |
| M≥4.7 | 5.302 | 0.000 | 28.000 | 2.000 | 0.000 | 0.795 (79.55%) | [79.30% 79.80%] | 0.065 (6.51%) | 3.334 |
| M≥4.8 | 4.201 | 0.000 | 22.000 | 2.000 | 0.000 | 0.749 (74.93%) | [74.66% 75.20%] | 0.065 (6.51%) | 2.638 |
| M≥4.9 | 3.331 | 0.000 | 18.000 | 1.000 | 0.000 | 0.700 (70.03%) | [69.75% 70.32%] | 0.065 (6.51%) | 2.094 |
| M≥5 | 2.634 | 0.000 | 14.000 | 1.000 | 0.000 | 0.646 (64.61%) | [64.32% 64.91%] | 0.065 (6.51%) | 1.657 |
| M≥5.1 | 2.086 | 0.000 | 12.000 | 1.000 | 0.000 | 0.590 (59.01%) | [58.70% 59.31%] | 0.065 (6.51%) | 1.312 |
| M≥5.2 | 1.653 | 0.000 | 9.000 | 1.000 | 0.000 | 0.534 (53.39%) | [53.08% 53.70%] | 0.065 (6.51%) | 1.041 |
| M≥5.3 | 1.303 | 0.000 | 8.000 | 0.000 | 0.000 | 0.476 (47.64%) | [47.33% 47.95%] | 0.065 (6.51%) | 0.821 |
| M≥5.4 | 1.028 | 0.000 | 6.000 | 0.000 | 0.000 | 0.422 (42.16%) | [41.86% 42.47%] | 0.065 (6.51%) | 0.649 |
| M≥5.5 | 0.809 | 0.000 | 5.000 | 0.000 | 0.000 | 0.369 (36.85%) | [36.55% 37.15%] | 0.065 (6.51%) | 0.511 |
| M≥5.6 | 0.636 | 0.000 | 4.000 | 0.000 | 0.000 | 0.320 (31.96%) | [31.67% 32.25%] | 0.065 (6.51%) | 0.403 |
| M≥5.7 | 0.497 | 0.000 | 3.000 | 0.000 | 0.000 | 0.272 (27.22%) | [26.95% 27.50%] | 0.065 (6.51%) | 0.314 |
| M≥5.8 | 0.388 | 0.000 | 3.000 | 0.000 | 0.000 | 0.230 (23.04%) | [22.77% 23.30%] | 0.065 (6.51%) | 0.245 |
| M≥5.9 | 0.299 | 0.000 | 2.000 | 0.000 | 0.000 | 0.191 (19.08%) | [18.84% 19.32%] | 0.065 (6.51%) | 0.189 |
| M≥6 | 0.232 | 0.000 | 2.000 | 0.000 | 0.000 | 0.158 (15.76%) | [15.54% 15.99%] | 0.065 (6.51%) | 0.147 |
| M≥6.1 | 0.181 | 0.000 | 2.000 | 0.000 | 0.000 | 0.130 (13.03%) | [12.82% 13.24%] | 0.065 (6.50%) | 0.115 |
| M≥6.2 | 0.145 | 0.000 | 1.000 | 0.000 | 0.000 | 0.110 (10.96%) | [10.77% 11.15%] | 0.064 (6.39%) | 0.093 |
| M≥6.3 | 0.104 | 0.000 | 1.000 | 0.000 | 0.000 | 0.083 (8.26%) | [8.09% 8.43%] | 0.050 (4.98%) | 0.066 |
| M≥6.4 | 0.063 | 0.000 | 1.000 | 0.000 | 0.000 | 0.052 (5.24%) | [5.10% 5.38%] | 0.031 (3.11%) | 0.039 |
| M≥6.5 | 0.051 | 0.000 | 1.000 | 0.000 | 0.000 | 0.044 (4.38%) | [4.26% 4.51%] | 0.030 (2.96%) | 0.032 |
| M≥6.6 | 0.041 | 0.000 | 1.000 | 0.000 | 0.000 | 0.036 (3.60%) | [3.49% 3.72%] | 0.027 (2.73%) | 0.026 |
| M≥6.7 | 0.034 | 0.000 | 1.000 | 0.000 | 0.000 | 0.031 (3.09%) | [2.99% 3.20%] | 0.026 (2.57%) | 0.022 |
| M≥6.8 | 0.021 | 0.000 | 0.000 | 0.000 | 0.000 | 0.019 (1.88%) | [1.79% 1.96%] | 0.015 (1.52%) | 0.013 |
| M≥6.9 | 0.018 | 0.000 | 0.000 | 0.000 | 0.000 | 0.017 (1.66%) | [1.58% 1.74%] | 0.015 (1.45%) | 0.011 |
| M≥7 | 0.013 | 0.000 | 0.000 | 0.000 | 0.000 | 0.012 (1.17%) | [1.10% 1.24%] | 0.010 (1.05%) | 7.89E-3 |
| M≥7.1 | 0.011 | 0.000 | 0.000 | 0.000 | 0.000 | 0.010 (1.04%) | [0.98% 1.11%] | 9.74E-3 (0.97%) | 7.17E-3 |
| M≥7.2 | 0.010 | 0.000 | 0.000 | 0.000 | 0.000 | 9.46E-3 (0.95%) | [0.89% 1.01%] | 9.09E-3 (0.91%) | 6.46E-3 |
| M≥7.3 | 8.80E-3 | 0.000 | 0.000 | 0.000 | 0.000 | 8.33E-3 (0.83%) | [0.78% 0.89%] | 8.20E-3 (0.82%) | 5.78E-3 |
| M≥7.4 | 7.35E-3 | 0.000 | 0.000 | 0.000 | 0.000 | 7.07E-3 (0.71%) | [0.66% 0.76%] | 7.02E-3 (0.70%) | 4.93E-3 |
| M≥7.5 | 5.07E-3 | 0.000 | 0.000 | 0.000 | 0.000 | 4.83E-3 (0.48%) | [0.44% 0.53%] | 4.83E-3 (0.48%) | 3.33E-3 |
| M≥7.6 | 2.33E-3 | 0.000 | 0.000 | 0.000 | 0.000 | 2.24E-3 (0.22%) | [0.20% 0.26%] | 2.24E-3 (0.22%) | 1.48E-3 |
| M≥7.7 | 1.29E-3 | 0.000 | 0.000 | 0.000 | 0.000 | 1.25E-3 (0.12%) | [0.10% 0.15%] | 1.25E-3 (0.12%) | 8.10E-4 |
| M≥7.8 | 6.00E-4 | 0.000 | 0.000 | 0.000 | 0.000 | 6.00E-4 (0.06%) | [0.05% 0.08%] | 6.00E-4 (0.06%) | 3.70E-4 |
| M≥7.9 | 2.00E-4 | 0.000 | 0.000 | 0.000 | 0.000 | 2.00E-4 (0.02%) | [0.01% 0.03%] | 2.00E-4 (0.02%) | 1.00E-4 |
| M≥8 | 9.00E-5 | 0.000 | 0.000 | 0.000 | 0.000 | 9.00E-5 (0.01%) | [0.00% 0.02%] | 9.00E-5 (0.01%) | 6.00E-5 |
| M≥8.1 | 2.00E-5 | 0.000 | 0.000 | 0.000 | 0.000 | 2.00E-5 (0.00%) | [0.00% 0.01%] | 2.00E-5 (0.00%) | 1.00E-5 |
| M≥8.2 | 0.000 | 0.000 | 0.000 | 0.000 | 0.000 | 0.000 (0.00%) | [0.00% 0.00%] | 0.000 (0.00%) | 0.000 |
| M≥8.3 | 0.000 | 0.000 | 0.000 | 0.000 | 0.000 | 0.000 (0.00%) | [0.00% 0.00%] | 0.000 (0.00%) | 0.000 |
| M≥8.4 | 0.000 | 0.000 | 0.000 | 0.000 | 0.000 | 0.000 (0.00%) | [0.00% 0.00%] | 0.000 (0.00%) | 0.000 |
| M≥8.5 | 0.000 | 0.000 | 0.000 | 0.000 | 0.000 | 0.000 (0.00%) | [0.00% 0.00%] | 0.000 (0.00%) | 0.000 |
| M≥8.6 | 0.000 | 0.000 | 0.000 | 0.000 | 0.000 | 0.000 (0.00%) | [0.00% 0.00%] | 0.000 (0.00%) | 0.000 |
| M≥8.7 | 0.000 | 0.000 | 0.000 | 0.000 | 0.000 | 0.000 (0.00%) | [0.00% 0.00%] | 0.000 (0.00%) | 0.000 |
| M≥8.8 | 0.000 | 0.000 | 0.000 | 0.000 | 0.000 | 0.000 (0.00%) | [0.00% 0.00%] | 0.000 (0.00%) | 0.000 |
| M≥8.9 | 0.000 | 0.000 | 0.000 | 0.000 | 0.000 | 0.000 (0.00%) | [0.00% 0.00%] | 0.000 (0.00%) | 0.000 |
| M≥9 | 0.000 | 0.000 | 0.000 | 0.000 | 0.000 | 0.000 (0.00%) | [0.00% 0.00%] | 0.000 (0.00%) | 0.000 |
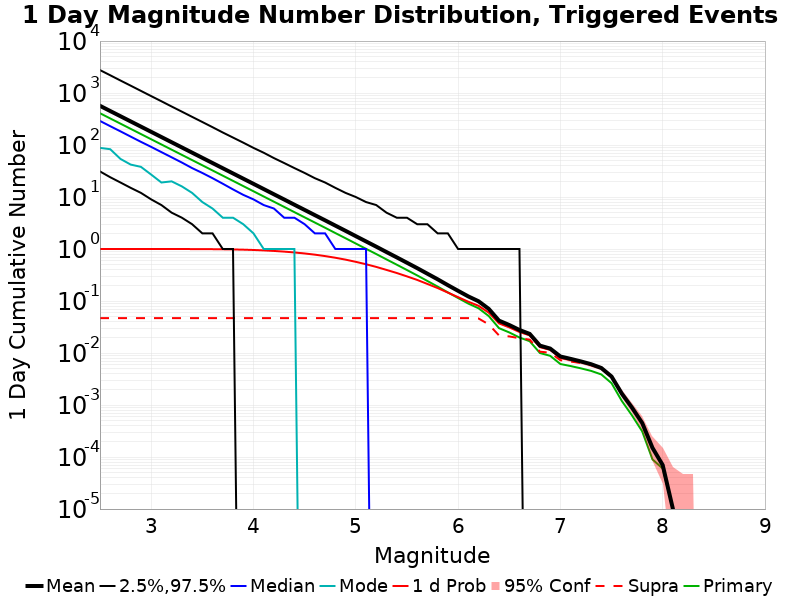
1 Day Magnitude Number Distribution
Legend
- Mean (thick black line): mean expected number across all 100000 catalogs
- 2.5%,97.5% (thin black lines): expected number percentiles across all 100000 catalogs
- Median (thin blue line): median expected number across all 100000 catalogs
- Mode (thin cyan line): modal expected number across all 100000 catalogs
- 1 d Probability (thin red line): 1 day probability calculated as the fraction of catalogs with at least 1 occurrence
- 1 d Supraseismogenic Probability (thin dashed red line): same as above, but only for supraseismogenic ruptures on explicitly modeled UCERF3 faults
- 95% Conf (light red shaded region): binomial 95% confidence bounds on probability
- Primary (thin green line): mean expected number from primary triggered aftershocks only (no secondary, tertiary, etc...) across all 100000 catalogs
| Mag | Mean | 2.5 %ile | 97.5 %ile | Median | Mode | 1 d Probability | 1 d Prob 95% Conf | 1 d Supra-Seis Prob | Primary Aftershocks Mean |
|---|---|---|---|---|---|---|---|---|---|
| M≥2.5 | 566.519 | 31.000 | 2757.000 | 290.000 | 88.000 | 1.000 (100.00%) | [99.99% 100.00%] | 0.047 (4.69%) | 407.993 |
| M≥2.6 | 449.960 | 24.000 | 2192.000 | 230.000 | 83.000 | 1.000 (100.00%) | [99.99% 100.00%] | 0.047 (4.69%) | 324.026 |
| M≥2.7 | 357.426 | 19.000 | 1738.000 | 183.000 | 54.000 | 1.000 (100.00%) | [99.99% 100.00%] | 0.047 (4.69%) | 257.405 |
| M≥2.8 | 283.927 | 15.000 | 1383.000 | 145.000 | 42.000 | 1.000 (100.00%) | [99.99% 100.00%] | 0.047 (4.69%) | 204.457 |
| M≥2.9 | 225.528 | 12.000 | 1098.000 | 115.000 | 38.000 | 1.000 (99.99%) | [99.98% 99.99%] | 0.047 (4.69%) | 162.389 |
| M≥3 | 179.179 | 9.000 | 872.000 | 92.000 | 27.000 | 1.000 (99.98%) | [99.96% 99.98%] | 0.047 (4.69%) | 129.019 |
| M≥3.1 | 142.315 | 7.000 | 694.000 | 73.000 | 19.000 | 1.000 (99.95%) | [99.94% 99.97%] | 0.047 (4.69%) | 102.479 |
| M≥3.2 | 113.042 | 5.000 | 550.000 | 58.000 | 20.000 | 0.999 (99.91%) | [99.88% 99.92%] | 0.047 (4.69%) | 81.392 |
| M≥3.3 | 89.778 | 4.000 | 438.000 | 46.000 | 16.000 | 0.998 (99.81%) | [99.78% 99.84%] | 0.047 (4.69%) | 64.635 |
| M≥3.4 | 71.321 | 3.000 | 348.000 | 36.000 | 12.000 | 0.997 (99.70%) | [99.66% 99.73%] | 0.047 (4.69%) | 51.337 |
| M≥3.5 | 56.638 | 2.000 | 277.000 | 29.000 | 8.000 | 0.995 (99.50%) | [99.46% 99.54%] | 0.047 (4.69%) | 40.771 |
| M≥3.6 | 44.992 | 2.000 | 220.000 | 23.000 | 6.000 | 0.992 (99.18%) | [99.12% 99.24%] | 0.047 (4.69%) | 32.389 |
| M≥3.7 | 35.731 | 1.000 | 174.000 | 18.000 | 4.000 | 0.987 (98.70%) | [98.63% 98.77%] | 0.047 (4.69%) | 25.719 |
| M≥3.8 | 28.381 | 1.000 | 139.000 | 14.000 | 4.000 | 0.980 (98.04%) | [97.95% 98.12%] | 0.047 (4.69%) | 20.431 |
| M≥3.9 | 22.544 | 0.000 | 111.000 | 11.000 | 3.000 | 0.971 (97.08%) | [96.97% 97.18%] | 0.047 (4.69%) | 16.230 |
| M≥4 | 17.909 | 0.000 | 88.000 | 9.000 | 2.000 | 0.958 (95.77%) | [95.64% 95.89%] | 0.047 (4.69%) | 12.891 |
| M≥4.1 | 14.216 | 0.000 | 71.000 | 7.000 | 1.000 | 0.940 (94.01%) | [93.86% 94.15%] | 0.047 (4.69%) | 10.231 |
| M≥4.2 | 11.281 | 0.000 | 56.000 | 6.000 | 1.000 | 0.918 (91.77%) | [91.60% 91.94%] | 0.047 (4.69%) | 8.122 |
| M≥4.3 | 8.960 | 0.000 | 45.000 | 4.000 | 1.000 | 0.891 (89.09%) | [88.89% 89.28%] | 0.047 (4.69%) | 6.452 |
| M≥4.4 | 7.105 | 0.000 | 36.000 | 4.000 | 1.000 | 0.858 (85.82%) | [85.60% 86.03%] | 0.047 (4.69%) | 5.115 |
| M≥4.5 | 5.642 | 0.000 | 29.000 | 3.000 | 0.000 | 0.821 (82.07%) | [81.83% 82.31%] | 0.047 (4.69%) | 4.061 |
| M≥4.6 | 4.479 | 0.000 | 23.000 | 2.000 | 0.000 | 0.779 (77.86%) | [77.60% 78.12%] | 0.047 (4.69%) | 3.227 |
| M≥4.7 | 3.559 | 0.000 | 19.000 | 2.000 | 0.000 | 0.731 (73.06%) | [72.79% 73.34%] | 0.047 (4.69%) | 2.563 |
| M≥4.8 | 2.819 | 0.000 | 15.000 | 1.000 | 0.000 | 0.679 (67.93%) | [67.64% 68.22%] | 0.047 (4.69%) | 2.028 |
| M≥4.9 | 2.235 | 0.000 | 12.000 | 1.000 | 0.000 | 0.624 (62.44%) | [62.14% 62.75%] | 0.047 (4.69%) | 1.610 |
| M≥5 | 1.768 | 0.000 | 10.000 | 1.000 | 0.000 | 0.567 (56.66%) | [56.35% 56.97%] | 0.047 (4.69%) | 1.275 |
| M≥5.1 | 1.400 | 0.000 | 8.000 | 1.000 | 0.000 | 0.509 (50.91%) | [50.60% 51.22%] | 0.047 (4.69%) | 1.009 |
| M≥5.2 | 1.109 | 0.000 | 7.000 | 0.000 | 0.000 | 0.453 (45.26%) | [44.95% 45.57%] | 0.047 (4.69%) | 0.800 |
| M≥5.3 | 0.874 | 0.000 | 5.000 | 0.000 | 0.000 | 0.396 (39.62%) | [39.32% 39.92%] | 0.047 (4.69%) | 0.631 |
| M≥5.4 | 0.691 | 0.000 | 4.000 | 0.000 | 0.000 | 0.346 (34.58%) | [34.29% 34.88%] | 0.047 (4.69%) | 0.500 |
| M≥5.5 | 0.545 | 0.000 | 4.000 | 0.000 | 0.000 | 0.298 (29.76%) | [29.47% 30.04%] | 0.047 (4.69%) | 0.394 |
| M≥5.6 | 0.429 | 0.000 | 3.000 | 0.000 | 0.000 | 0.254 (25.45%) | [25.18% 25.72%] | 0.047 (4.69%) | 0.311 |
| M≥5.7 | 0.335 | 0.000 | 3.000 | 0.000 | 0.000 | 0.213 (21.27%) | [21.02% 21.53%] | 0.047 (4.69%) | 0.243 |
| M≥5.8 | 0.262 | 0.000 | 2.000 | 0.000 | 0.000 | 0.178 (17.75%) | [17.51% 17.99%] | 0.047 (4.69%) | 0.189 |
| M≥5.9 | 0.202 | 0.000 | 2.000 | 0.000 | 0.000 | 0.145 (14.50%) | [14.28% 14.72%] | 0.047 (4.69%) | 0.146 |
| M≥6 | 0.157 | 0.000 | 1.000 | 0.000 | 0.000 | 0.119 (11.87%) | [11.67% 12.07%] | 0.047 (4.69%) | 0.114 |
| M≥6.1 | 0.122 | 0.000 | 1.000 | 0.000 | 0.000 | 0.097 (9.69%) | [9.50% 9.87%] | 0.047 (4.68%) | 0.089 |
| M≥6.2 | 0.099 | 0.000 | 1.000 | 0.000 | 0.000 | 0.081 (8.06%) | [7.90% 8.23%] | 0.046 (4.61%) | 0.072 |
| M≥6.3 | 0.070 | 0.000 | 1.000 | 0.000 | 0.000 | 0.060 (5.97%) | [5.82% 6.12%] | 0.035 (3.54%) | 0.051 |
| M≥6.4 | 0.042 | 0.000 | 1.000 | 0.000 | 0.000 | 0.037 (3.71%) | [3.60% 3.83%] | 0.022 (2.18%) | 0.030 |
| M≥6.5 | 0.035 | 0.000 | 1.000 | 0.000 | 0.000 | 0.031 (3.11%) | [3.01% 3.22%] | 0.021 (2.08%) | 0.025 |
| M≥6.6 | 0.028 | 0.000 | 1.000 | 0.000 | 0.000 | 0.025 (2.54%) | [2.45% 2.64%] | 0.019 (1.92%) | 0.020 |
| M≥6.7 | 0.023 | 0.000 | 0.000 | 0.000 | 0.000 | 0.022 (2.18%) | [2.09% 2.27%] | 0.018 (1.81%) | 0.017 |
| M≥6.8 | 0.014 | 0.000 | 0.000 | 0.000 | 0.000 | 0.013 (1.30%) | [1.23% 1.37%] | 0.011 (1.06%) | 9.99E-3 |
| M≥6.9 | 0.012 | 0.000 | 0.000 | 0.000 | 0.000 | 0.012 (1.15%) | [1.09% 1.22%] | 0.010 (1.01%) | 8.83E-3 |
| M≥7 | 8.57E-3 | 0.000 | 0.000 | 0.000 | 0.000 | 8.08E-3 (0.81%) | [0.75% 0.87%] | 7.27E-3 (0.73%) | 6.14E-3 |
| M≥7.1 | 7.71E-3 | 0.000 | 0.000 | 0.000 | 0.000 | 7.33E-3 (0.73%) | [0.68% 0.79%] | 6.85E-3 (0.69%) | 5.61E-3 |
| M≥7.2 | 6.89E-3 | 0.000 | 0.000 | 0.000 | 0.000 | 6.66E-3 (0.67%) | [0.62% 0.72%] | 6.41E-3 (0.64%) | 5.07E-3 |
| M≥7.3 | 6.09E-3 | 0.000 | 0.000 | 0.000 | 0.000 | 5.93E-3 (0.59%) | [0.55% 0.64%] | 5.84E-3 (0.58%) | 4.53E-3 |
| M≥7.4 | 5.15E-3 | 0.000 | 0.000 | 0.000 | 0.000 | 5.06E-3 (0.51%) | [0.46% 0.55%] | 5.03E-3 (0.50%) | 3.87E-3 |
| M≥7.5 | 3.53E-3 | 0.000 | 0.000 | 0.000 | 0.000 | 3.46E-3 (0.35%) | [0.31% 0.38%] | 3.46E-3 (0.35%) | 2.63E-3 |
| M≥7.6 | 1.66E-3 | 0.000 | 0.000 | 0.000 | 0.000 | 1.63E-3 (0.16%) | [0.14% 0.19%] | 1.63E-3 (0.16%) | 1.20E-3 |
| M≥7.7 | 8.90E-4 | 0.000 | 0.000 | 0.000 | 0.000 | 8.70E-4 (0.09%) | [0.07% 0.11%] | 8.70E-4 (0.09%) | 6.30E-4 |
| M≥7.8 | 4.50E-4 | 0.000 | 0.000 | 0.000 | 0.000 | 4.50E-4 (0.04%) | [0.03% 0.06%] | 4.50E-4 (0.04%) | 3.10E-4 |
| M≥7.9 | 1.50E-4 | 0.000 | 0.000 | 0.000 | 0.000 | 1.50E-4 (0.01%) | [0.01% 0.03%] | 1.50E-4 (0.01%) | 9.00E-5 |
| M≥8 | 7.00E-5 | 0.000 | 0.000 | 0.000 | 0.000 | 7.00E-5 (0.01%) | [0.00% 0.02%] | 7.00E-5 (0.01%) | 6.00E-5 |
| M≥8.1 | 1.00E-5 | 0.000 | 0.000 | 0.000 | 0.000 | 1.00E-5 (0.00%) | [0.00% 0.01%] | 1.00E-5 (0.00%) | 1.00E-5 |
| M≥8.2 | 0.000 | 0.000 | 0.000 | 0.000 | 0.000 | 0.000 (0.00%) | [0.00% 0.00%] | 0.000 (0.00%) | 0.000 |
| M≥8.3 | 0.000 | 0.000 | 0.000 | 0.000 | 0.000 | 0.000 (0.00%) | [0.00% 0.00%] | 0.000 (0.00%) | 0.000 |
| M≥8.4 | 0.000 | 0.000 | 0.000 | 0.000 | 0.000 | 0.000 (0.00%) | [0.00% 0.00%] | 0.000 (0.00%) | 0.000 |
| M≥8.5 | 0.000 | 0.000 | 0.000 | 0.000 | 0.000 | 0.000 (0.00%) | [0.00% 0.00%] | 0.000 (0.00%) | 0.000 |
| M≥8.6 | 0.000 | 0.000 | 0.000 | 0.000 | 0.000 | 0.000 (0.00%) | [0.00% 0.00%] | 0.000 (0.00%) | 0.000 |
| M≥8.7 | 0.000 | 0.000 | 0.000 | 0.000 | 0.000 | 0.000 (0.00%) | [0.00% 0.00%] | 0.000 (0.00%) | 0.000 |
| M≥8.8 | 0.000 | 0.000 | 0.000 | 0.000 | 0.000 | 0.000 (0.00%) | [0.00% 0.00%] | 0.000 (0.00%) | 0.000 |
| M≥8.9 | 0.000 | 0.000 | 0.000 | 0.000 | 0.000 | 0.000 (0.00%) | [0.00% 0.00%] | 0.000 (0.00%) | 0.000 |
| M≥9 | 0.000 | 0.000 | 0.000 | 0.000 | 0.000 | 0.000 (0.00%) | [0.00% 0.00%] | 0.000 (0.00%) | 0.000 |
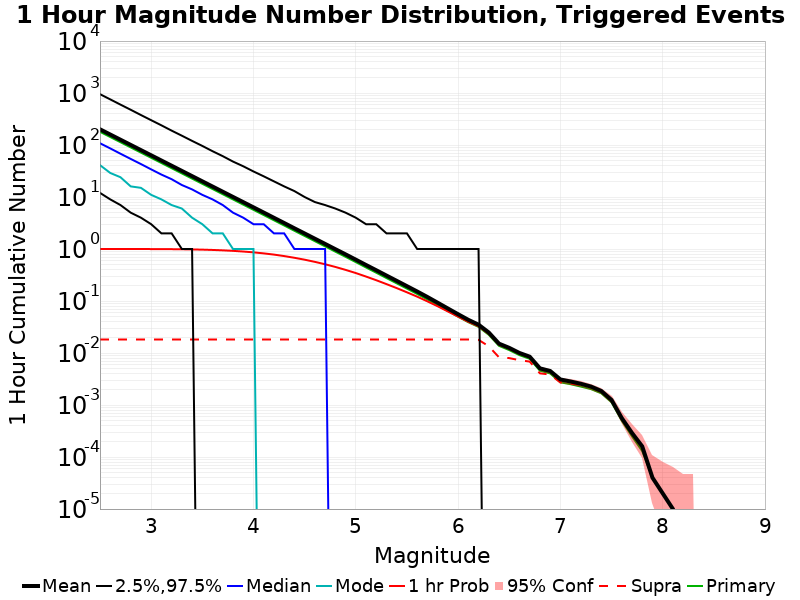
1 Hour Magnitude Number Distribution
Legend
- Mean (thick black line): mean expected number across all 100000 catalogs
- 2.5%,97.5% (thin black lines): expected number percentiles across all 100000 catalogs
- Median (thin blue line): median expected number across all 100000 catalogs
- Mode (thin cyan line): modal expected number across all 100000 catalogs
- 1 hr Probability (thin red line): 1 hour probability calculated as the fraction of catalogs with at least 1 occurrence
- 1 hr Supraseismogenic Probability (thin dashed red line): same as above, but only for supraseismogenic ruptures on explicitly modeled UCERF3 faults
- 95% Conf (light red shaded region): binomial 95% confidence bounds on probability
- Primary (thin green line): mean expected number from primary triggered aftershocks only (no secondary, tertiary, etc...) across all 100000 catalogs
| Mag | Mean | 2.5 %ile | 97.5 %ile | Median | Mode | 1 hr Probability | 1 hr Prob 95% Conf | 1 hr Supra-Seis Prob | Primary Aftershocks Mean |
|---|---|---|---|---|---|---|---|---|---|
| M≥2.5 | 200.261 | 12.000 | 949.000 | 108.000 | 41.000 | 1.000 (99.98%) | [99.97% 99.99%] | 0.018 (1.82%) | 179.387 |
| M≥2.6 | 159.063 | 9.000 | 754.000 | 86.000 | 29.000 | 1.000 (99.98%) | [99.97% 99.99%] | 0.018 (1.82%) | 142.479 |
| M≥2.7 | 126.351 | 7.000 | 598.000 | 68.000 | 24.000 | 1.000 (99.97%) | [99.95% 99.98%] | 0.018 (1.82%) | 113.182 |
| M≥2.8 | 100.381 | 5.000 | 476.000 | 54.000 | 16.000 | 0.999 (99.92%) | [99.90% 99.94%] | 0.018 (1.82%) | 89.918 |
| M≥2.9 | 79.725 | 4.000 | 377.000 | 43.000 | 15.000 | 0.999 (99.85%) | [99.83% 99.88%] | 0.018 (1.82%) | 71.413 |
| M≥3 | 63.353 | 3.000 | 300.000 | 34.000 | 11.000 | 0.997 (99.70%) | [99.67% 99.74%] | 0.018 (1.82%) | 56.755 |
| M≥3.1 | 50.315 | 2.000 | 239.000 | 27.000 | 9.000 | 0.995 (99.53%) | [99.49% 99.57%] | 0.018 (1.82%) | 45.070 |
| M≥3.2 | 39.966 | 2.000 | 189.000 | 22.000 | 7.000 | 0.992 (99.21%) | [99.16% 99.27%] | 0.018 (1.82%) | 35.799 |
| M≥3.3 | 31.745 | 1.000 | 151.000 | 17.000 | 6.000 | 0.988 (98.78%) | [98.71% 98.85%] | 0.018 (1.82%) | 28.434 |
| M≥3.4 | 25.212 | 1.000 | 120.000 | 14.000 | 4.000 | 0.981 (98.12%) | [98.04% 98.21%] | 0.018 (1.82%) | 22.584 |
| M≥3.5 | 20.017 | 0.000 | 96.000 | 11.000 | 3.000 | 0.972 (97.20%) | [97.09% 97.30%] | 0.018 (1.82%) | 17.931 |
| M≥3.6 | 15.906 | 0.000 | 76.000 | 9.000 | 2.000 | 0.959 (95.90%) | [95.78% 96.02%] | 0.018 (1.82%) | 14.248 |
| M≥3.7 | 12.626 | 0.000 | 61.000 | 7.000 | 2.000 | 0.942 (94.24%) | [94.10% 94.39%] | 0.018 (1.82%) | 11.311 |
| M≥3.8 | 10.030 | 0.000 | 48.000 | 5.000 | 1.000 | 0.921 (92.12%) | [91.95% 92.29%] | 0.018 (1.82%) | 8.988 |
| M≥3.9 | 7.965 | 0.000 | 39.000 | 4.000 | 1.000 | 0.894 (89.38%) | [89.19% 89.57%] | 0.018 (1.82%) | 7.137 |
| M≥4 | 6.326 | 0.000 | 31.000 | 3.000 | 1.000 | 0.862 (86.21%) | [86.00% 86.43%] | 0.018 (1.82%) | 5.669 |
| M≥4.1 | 5.023 | 0.000 | 25.000 | 3.000 | 0.000 | 0.824 (82.38%) | [82.14% 82.62%] | 0.018 (1.82%) | 4.500 |
| M≥4.2 | 3.984 | 0.000 | 20.000 | 2.000 | 0.000 | 0.781 (78.07%) | [77.81% 78.32%] | 0.018 (1.82%) | 3.570 |
| M≥4.3 | 3.162 | 0.000 | 16.000 | 2.000 | 0.000 | 0.731 (73.11%) | [72.83% 73.38%] | 0.018 (1.82%) | 2.833 |
| M≥4.4 | 2.504 | 0.000 | 13.000 | 1.000 | 0.000 | 0.678 (67.81%) | [67.51% 68.09%] | 0.018 (1.82%) | 2.244 |
| M≥4.5 | 1.989 | 0.000 | 10.000 | 1.000 | 0.000 | 0.623 (62.31%) | [62.00% 62.61%] | 0.018 (1.82%) | 1.782 |
| M≥4.6 | 1.578 | 0.000 | 8.000 | 1.000 | 0.000 | 0.566 (56.59%) | [56.28% 56.90%] | 0.018 (1.82%) | 1.415 |
| M≥4.7 | 1.254 | 0.000 | 7.000 | 1.000 | 0.000 | 0.509 (50.89%) | [50.58% 51.20%] | 0.018 (1.82%) | 1.124 |
| M≥4.8 | 0.993 | 0.000 | 6.000 | 0.000 | 0.000 | 0.452 (45.21%) | [44.90% 45.52%] | 0.018 (1.82%) | 0.890 |
| M≥4.9 | 0.789 | 0.000 | 5.000 | 0.000 | 0.000 | 0.397 (39.68%) | [39.38% 39.99%] | 0.018 (1.82%) | 0.708 |
| M≥5 | 0.624 | 0.000 | 4.000 | 0.000 | 0.000 | 0.345 (34.49%) | [34.20% 34.79%] | 0.018 (1.82%) | 0.560 |
| M≥5.1 | 0.493 | 0.000 | 3.000 | 0.000 | 0.000 | 0.295 (29.52%) | [29.24% 29.81%] | 0.018 (1.82%) | 0.442 |
| M≥5.2 | 0.391 | 0.000 | 3.000 | 0.000 | 0.000 | 0.251 (25.11%) | [24.84% 25.38%] | 0.018 (1.82%) | 0.350 |
| M≥5.3 | 0.309 | 0.000 | 2.000 | 0.000 | 0.000 | 0.211 (21.13%) | [20.87% 21.38%] | 0.018 (1.82%) | 0.276 |
| M≥5.4 | 0.244 | 0.000 | 2.000 | 0.000 | 0.000 | 0.177 (17.70%) | [17.47% 17.94%] | 0.018 (1.82%) | 0.219 |
| M≥5.5 | 0.193 | 0.000 | 2.000 | 0.000 | 0.000 | 0.147 (14.70%) | [14.48% 14.92%] | 0.018 (1.82%) | 0.173 |
| M≥5.6 | 0.152 | 0.000 | 1.000 | 0.000 | 0.000 | 0.121 (12.13%) | [11.93% 12.33%] | 0.018 (1.82%) | 0.137 |
| M≥5.7 | 0.119 | 0.000 | 1.000 | 0.000 | 0.000 | 0.099 (9.86%) | [9.68% 10.05%] | 0.018 (1.82%) | 0.107 |
| M≥5.8 | 0.093 | 0.000 | 1.000 | 0.000 | 0.000 | 0.079 (7.93%) | [7.77% 8.10%] | 0.018 (1.82%) | 0.083 |
| M≥5.9 | 0.072 | 0.000 | 1.000 | 0.000 | 0.000 | 0.063 (6.30%) | [6.15% 6.45%] | 0.018 (1.82%) | 0.064 |
| M≥6 | 0.056 | 0.000 | 1.000 | 0.000 | 0.000 | 0.050 (5.01%) | [4.88% 5.15%] | 0.018 (1.82%) | 0.050 |
| M≥6.1 | 0.043 | 0.000 | 1.000 | 0.000 | 0.000 | 0.040 (3.98%) | [3.87% 4.11%] | 0.018 (1.81%) | 0.039 |
| M≥6.2 | 0.035 | 0.000 | 1.000 | 0.000 | 0.000 | 0.033 (3.26%) | [3.16% 3.38%] | 0.018 (1.79%) | 0.032 |
| M≥6.3 | 0.025 | 0.000 | 0.000 | 0.000 | 0.000 | 0.023 (2.34%) | [2.24% 2.43%] | 0.013 (1.35%) | 0.022 |
| M≥6.4 | 0.015 | 0.000 | 0.000 | 0.000 | 0.000 | 0.015 (1.45%) | [1.38% 1.53%] | 8.26E-3 (0.83%) | 0.014 |
| M≥6.5 | 0.013 | 0.000 | 0.000 | 0.000 | 0.000 | 0.012 (1.21%) | [1.15% 1.29%] | 7.98E-3 (0.80%) | 0.011 |
| M≥6.6 | 0.010 | 0.000 | 0.000 | 0.000 | 0.000 | 9.74E-3 (0.97%) | [0.91% 1.04%] | 7.27E-3 (0.73%) | 9.10E-3 |
| M≥6.7 | 8.50E-3 | 0.000 | 0.000 | 0.000 | 0.000 | 8.34E-3 (0.83%) | [0.78% 0.89%] | 6.84E-3 (0.68%) | 7.73E-3 |
| M≥6.8 | 5.07E-3 | 0.000 | 0.000 | 0.000 | 0.000 | 4.97E-3 (0.50%) | [0.45% 0.54%] | 4.06E-3 (0.41%) | 4.57E-3 |
| M≥6.9 | 4.51E-3 | 0.000 | 0.000 | 0.000 | 0.000 | 4.41E-3 (0.44%) | [0.40% 0.48%] | 3.86E-3 (0.39%) | 4.05E-3 |
| M≥7 | 3.10E-3 | 0.000 | 0.000 | 0.000 | 0.000 | 3.01E-3 (0.30%) | [0.27% 0.34%] | 2.71E-3 (0.27%) | 2.73E-3 |
| M≥7.1 | 2.83E-3 | 0.000 | 0.000 | 0.000 | 0.000 | 2.76E-3 (0.28%) | [0.24% 0.31%] | 2.58E-3 (0.26%) | 2.51E-3 |
| M≥7.2 | 2.56E-3 | 0.000 | 0.000 | 0.000 | 0.000 | 2.51E-3 (0.25%) | [0.22% 0.28%] | 2.43E-3 (0.24%) | 2.26E-3 |
| M≥7.3 | 2.26E-3 | 0.000 | 0.000 | 0.000 | 0.000 | 2.22E-3 (0.22%) | [0.19% 0.25%] | 2.19E-3 (0.22%) | 2.02E-3 |
| M≥7.4 | 1.86E-3 | 0.000 | 0.000 | 0.000 | 0.000 | 1.85E-3 (0.18%) | [0.16% 0.21%] | 1.84E-3 (0.18%) | 1.68E-3 |
| M≥7.5 | 1.25E-3 | 0.000 | 0.000 | 0.000 | 0.000 | 1.24E-3 (0.12%) | [0.10% 0.15%] | 1.24E-3 (0.12%) | 1.13E-3 |
| M≥7.6 | 5.60E-4 | 0.000 | 0.000 | 0.000 | 0.000 | 5.60E-4 (0.06%) | [0.04% 0.07%] | 5.60E-4 (0.06%) | 5.00E-4 |
| M≥7.7 | 2.90E-4 | 0.000 | 0.000 | 0.000 | 0.000 | 2.90E-4 (0.03%) | [0.02% 0.04%] | 2.90E-4 (0.03%) | 2.50E-4 |
| M≥7.8 | 1.60E-4 | 0.000 | 0.000 | 0.000 | 0.000 | 1.60E-4 (0.02%) | [0.01% 0.03%] | 1.60E-4 (0.02%) | 1.30E-4 |
| M≥7.9 | 4.00E-5 | 0.000 | 0.000 | 0.000 | 0.000 | 4.00E-5 (0.00%) | [0.00% 0.01%] | 4.00E-5 (0.00%) | 4.00E-5 |
| M≥8 | 2.00E-5 | 0.000 | 0.000 | 0.000 | 0.000 | 2.00E-5 (0.00%) | [0.00% 0.01%] | 2.00E-5 (0.00%) | 2.00E-5 |
| M≥8.1 | 1.00E-5 | 0.000 | 0.000 | 0.000 | 0.000 | 1.00E-5 (0.00%) | [0.00% 0.01%] | 1.00E-5 (0.00%) | 1.00E-5 |
| M≥8.2 | 0.000 | 0.000 | 0.000 | 0.000 | 0.000 | 0.000 (0.00%) | [0.00% 0.00%] | 0.000 (0.00%) | 0.000 |
| M≥8.3 | 0.000 | 0.000 | 0.000 | 0.000 | 0.000 | 0.000 (0.00%) | [0.00% 0.00%] | 0.000 (0.00%) | 0.000 |
| M≥8.4 | 0.000 | 0.000 | 0.000 | 0.000 | 0.000 | 0.000 (0.00%) | [0.00% 0.00%] | 0.000 (0.00%) | 0.000 |
| M≥8.5 | 0.000 | 0.000 | 0.000 | 0.000 | 0.000 | 0.000 (0.00%) | [0.00% 0.00%] | 0.000 (0.00%) | 0.000 |
| M≥8.6 | 0.000 | 0.000 | 0.000 | 0.000 | 0.000 | 0.000 (0.00%) | [0.00% 0.00%] | 0.000 (0.00%) | 0.000 |
| M≥8.7 | 0.000 | 0.000 | 0.000 | 0.000 | 0.000 | 0.000 (0.00%) | [0.00% 0.00%] | 0.000 (0.00%) | 0.000 |
| M≥8.8 | 0.000 | 0.000 | 0.000 | 0.000 | 0.000 | 0.000 (0.00%) | [0.00% 0.00%] | 0.000 (0.00%) | 0.000 |
| M≥8.9 | 0.000 | 0.000 | 0.000 | 0.000 | 0.000 | 0.000 (0.00%) | [0.00% 0.00%] | 0.000 (0.00%) | 0.000 |
| M≥9 | 0.000 | 0.000 | 0.000 | 0.000 | 0.000 | 0.000 (0.00%) | [0.00% 0.00%] | 0.000 (0.00%) | 0.000 |
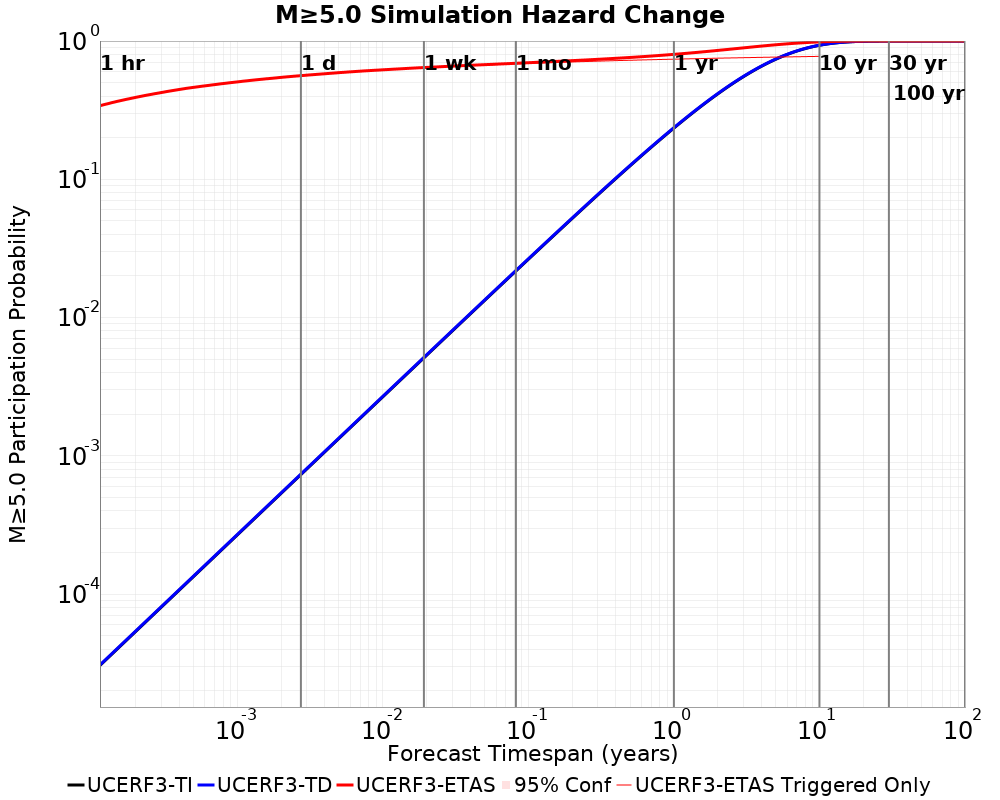
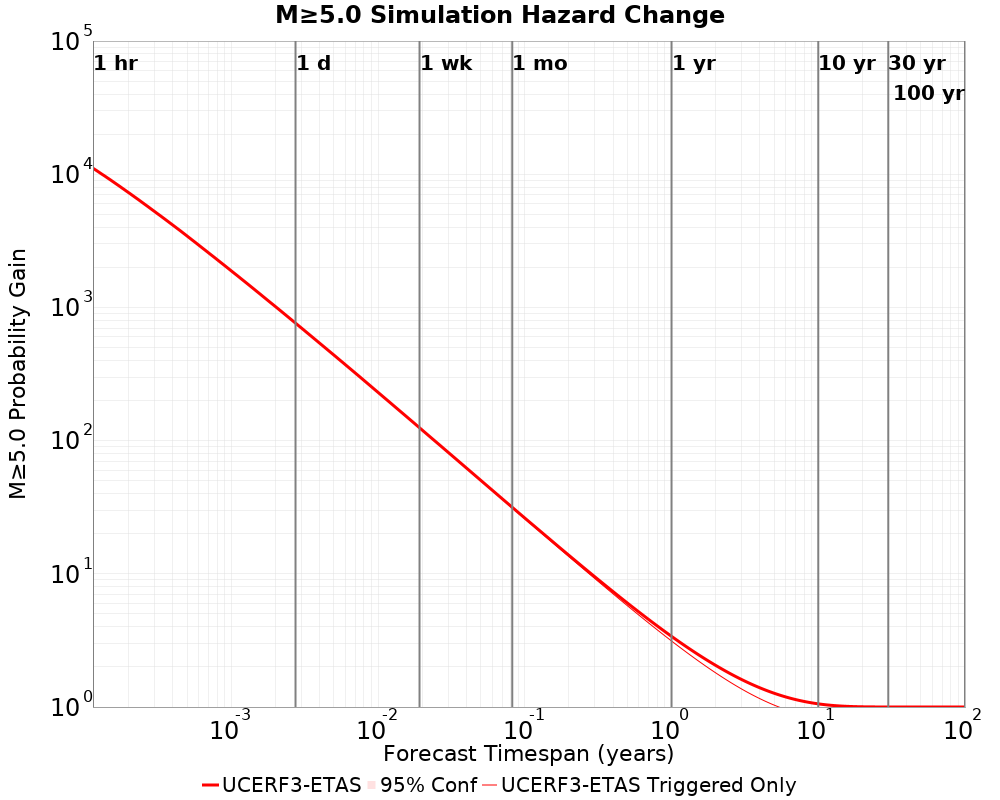
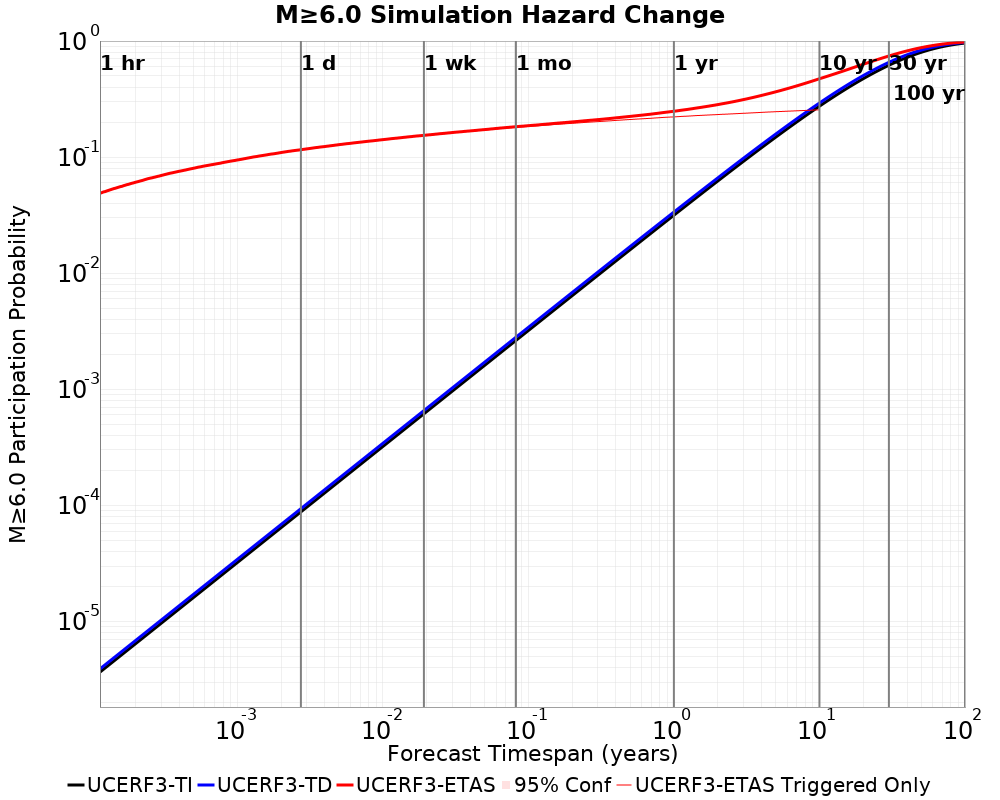
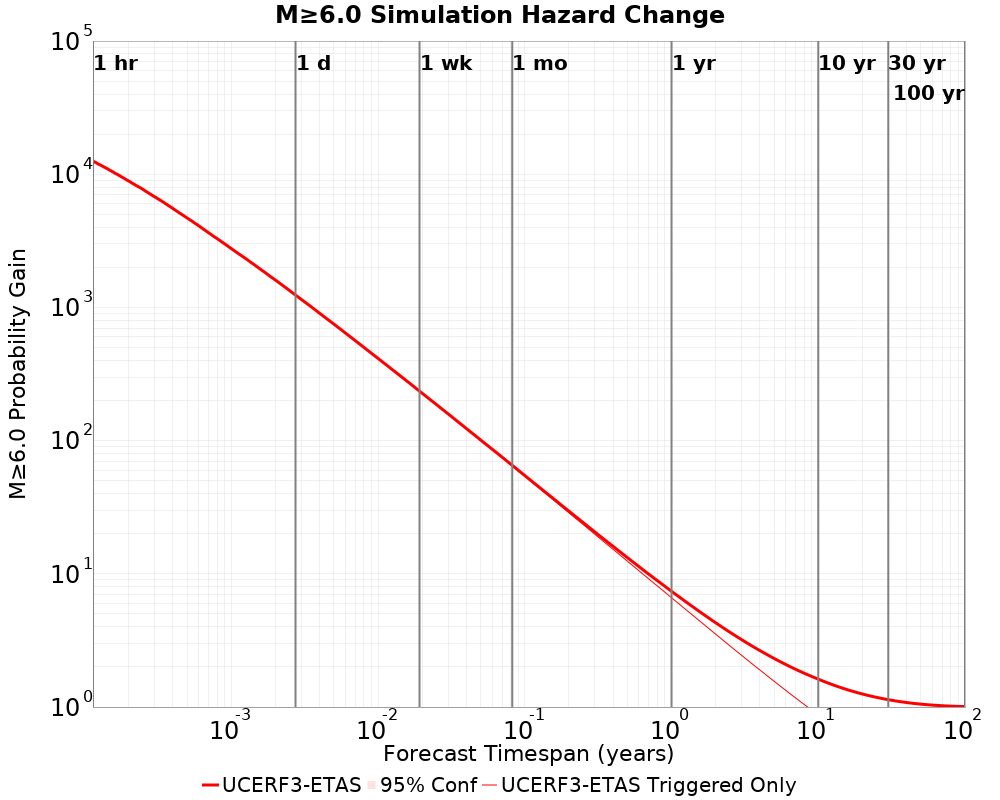
Hazard Change Over Time
These plots show how the probability of ruptures of various magnitudes within the region used to fetch ComCat trigger ruptures changes over time
M≥5.0 Hazard Change Over Time
 |  |
|---|
| Forecast Duration | UCERF3-ETAS [95% Conf] | UCERF3-ETAS Triggered Only | UCERF3-TD | UCERF3-ETAS/TD Gain | UCERF3-TI |
|---|---|---|---|---|---|
| 1 Hour | 0.340 [0.337 - 0.343] | 0.340 | 3.07E-5 | 11079.65 | 3.05E-5 |
| 1 Day | 0.561 [0.558 - 0.565] | 0.561 | 7.37E-4 | 761.8 | 7.31E-4 |
| 1 Week | 0.642 [0.640 - 0.645] | 0.641 | 5.15E-3 | 124.82 | 5.11E-3 |
| 1 Month | 0.690 [0.687 - 0.693] | 0.683 | 0.022 | 31.54 | 0.022 |
| 1 Year | 0.801 [0.798 - 0.803] | 0.739 | 0.236 | 3.39 | 0.234 |
| 10 Years | 0.985 [0.985 - 0.985] | 0.774 | 0.933 | 1.06 | 0.931 |
| 30 Years | 1.000 [1.000 - 1.000] * | * | 1.000 | 1 * | 1.000 |
| 100 Years | 1.000 [1.000 - 1.000] * | * | 1.000 | 1 * | 1.000 |
* forecast duration is longer than simulation length, only ETAS ruptures from the first 10 years are included
M≥6.0 Hazard Change Over Time
 |  |
|---|
| Forecast Duration | UCERF3-ETAS [95% Conf] | UCERF3-ETAS Triggered Only | UCERF3-TD | UCERF3-ETAS/TD Gain | UCERF3-TI |
|---|---|---|---|---|---|
| 1 Hour | 0.049 [0.048 - 0.050] | 0.049 | 3.90E-6 | 12539.21 | 3.66E-6 |
| 1 Day | 0.116 [0.114 - 0.118] | 0.116 | 9.35E-5 | 1238.04 | 8.78E-5 |
| 1 Week | 0.154 [0.152 - 0.156] | 0.153 | 6.54E-4 | 235.22 | 6.15E-4 |
| 1 Month | 0.183 [0.180 - 0.185] | 0.180 | 2.80E-3 | 65.18 | 2.63E-3 |
| 1 Year | 0.248 [0.246 - 0.251] | 0.222 | 0.034 | 7.39 | 0.032 |
| 10 Years | 0.473 [0.471 - 0.475] | 0.255 | 0.292 | 1.62 | 0.274 |
| 30 Years | 0.743 [0.742 - 0.744] * | * | 0.655 | 1.13 * | 0.618 |
| 100 Years | 0.980 [0.980 - 0.980] * | * | 0.973 | 1.01 * | 0.960 |
* forecast duration is longer than simulation length, only ETAS ruptures from the first 10 years are included
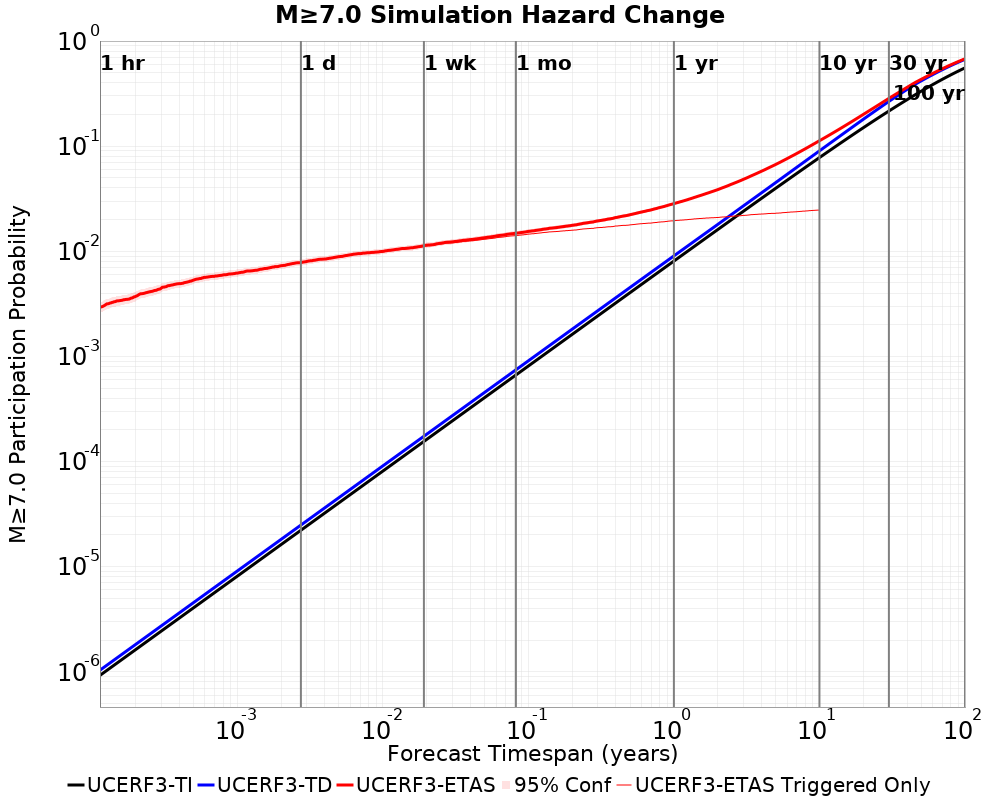
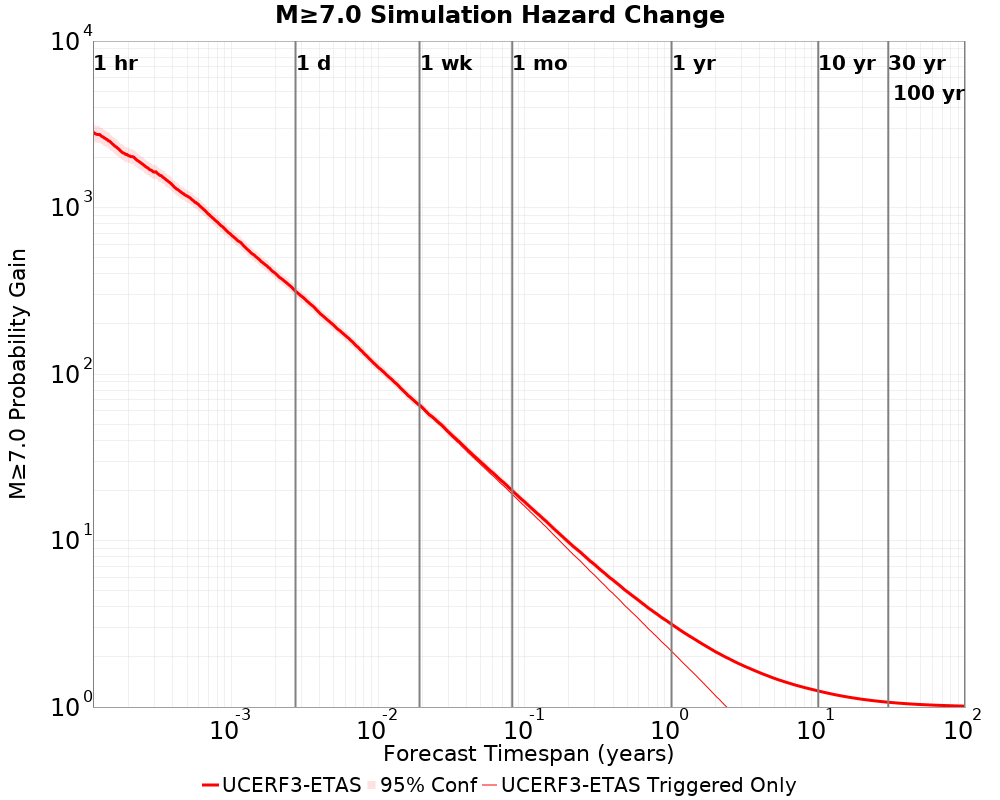
M≥7.0 Hazard Change Over Time
 |  |
|---|
| Forecast Duration | UCERF3-ETAS [95% Conf] | UCERF3-ETAS Triggered Only | UCERF3-TD | UCERF3-ETAS/TD Gain | UCERF3-TI |
|---|---|---|---|---|---|
| 1 Hour | 2.94E-3 [2.62E-3 - 3.30E-3] | 2.94E-3 | 1.03E-6 | 2842.8 | 9.23E-7 |
| 1 Day | 7.80E-3 [7.27E-3 - 8.37E-3] | 7.78E-3 | 2.48E-5 | 314.34 | 2.22E-5 |
| 1 Week | 0.011 [0.011 - 0.012] | 0.011 | 1.74E-4 | 65.09 | 1.55E-4 |
| 1 Month | 0.015 [0.014 - 0.016] | 0.014 | 7.45E-4 | 19.92 | 6.65E-4 |
| 1 Year | 0.028 [0.028 - 0.029] | 0.020 | 9.03E-3 | 3.14 | 8.06E-3 |
| 10 Years | 0.113 [0.112 - 0.113] | 0.025 | 0.090 | 1.25 | 0.078 |
| 30 Years | 0.284 [0.284 - 0.285] * | * | 0.266 | 1.07 * | 0.216 |
| 100 Years | 0.677 [0.677 - 0.677] * | * | 0.669 | 1.01 * | 0.555 |
* forecast duration is longer than simulation length, only ETAS ruptures from the first 10 years are included
M≥8.0 Hazard Change Over Time
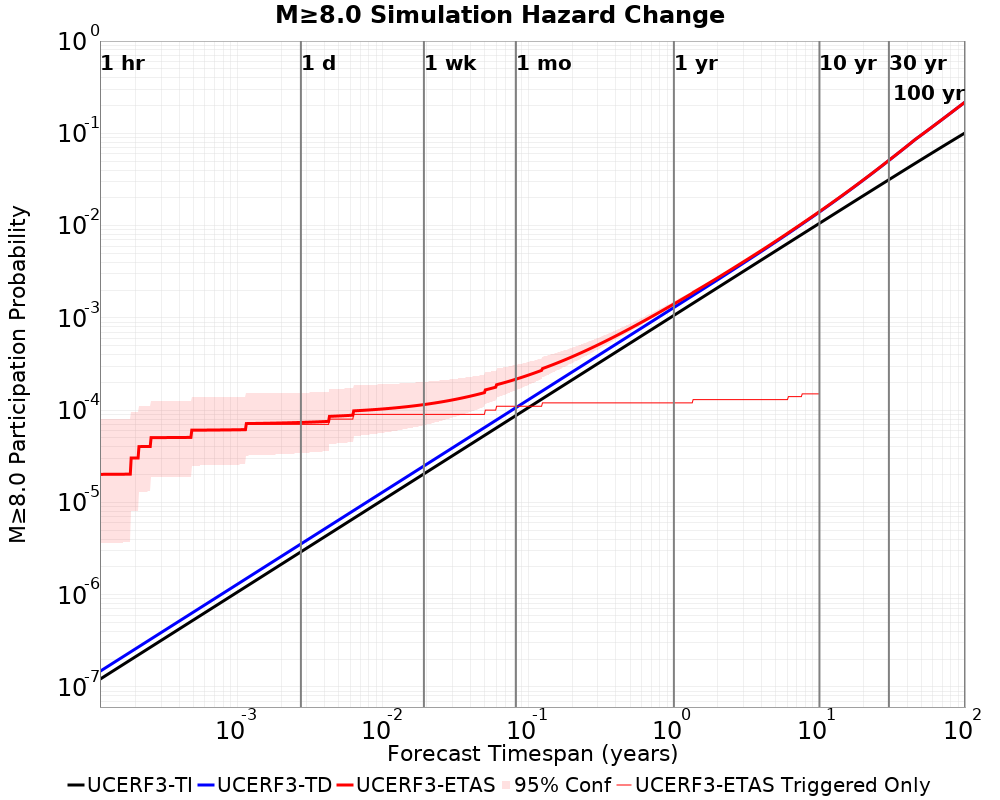 | 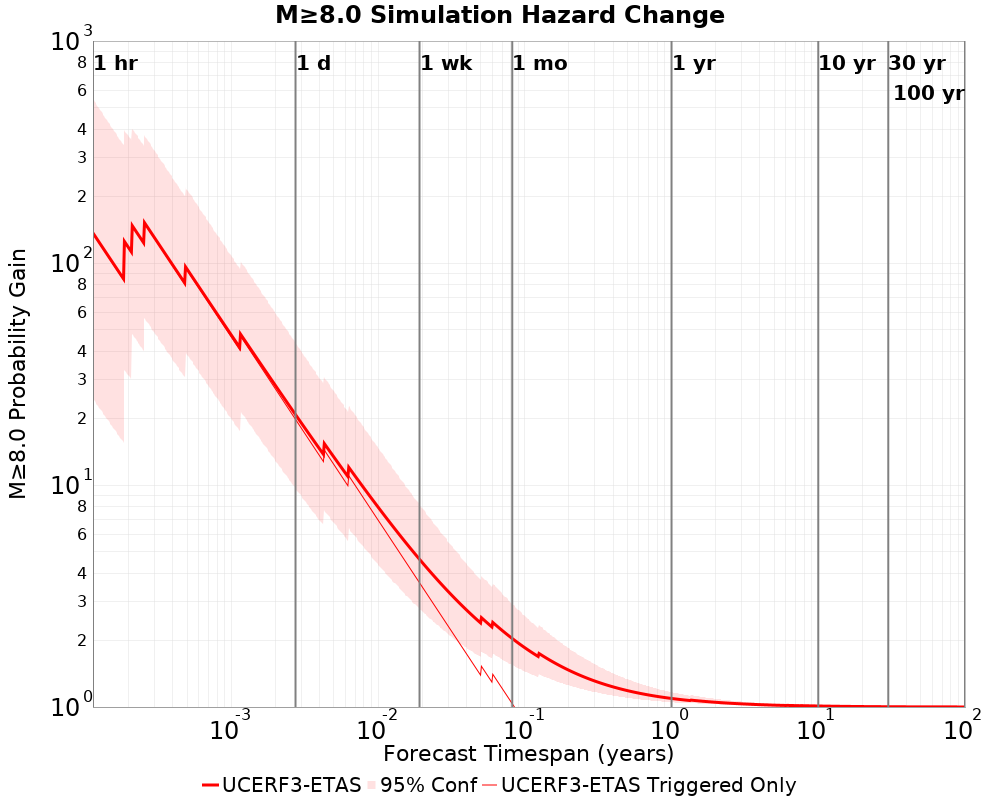 |
|---|
| Forecast Duration | UCERF3-ETAS [95% Conf] | UCERF3-ETAS Triggered Only | UCERF3-TD | UCERF3-ETAS/TD Gain | UCERF3-TI |
|---|---|---|---|---|---|
| 1 Hour | 2.01E-5 [3.61E-6 - 8.08E-5] | 2.00E-5 | 1.48E-7 | 136.43 | 1.21E-7 |
| 1 Day | 7.35E-5 [3.42E-5 - 1.55E-4] | 7.00E-5 | 3.54E-6 | 20.75 | 2.91E-6 |
| 1 Week | 1.15E-4 [6.87E-5 - 2.02E-4] | 9.00E-5 | 2.48E-5 | 4.63 | 2.04E-5 |
| 1 Month | 2.16E-4 [1.64E-4 - 3.10E-4] | 1.10E-4 | 1.06E-4 | 2.03 | 8.73E-5 |
| 1 Year | 1.41E-3 [1.36E-3 - 1.51E-3] | 1.20E-4 | 1.29E-3 | 1.09 | 1.06E-3 |
| 10 Years | 0.014 [0.014 - 0.014] | 1.50E-4 | 0.014 | 1.01 | 0.011 |
| 30 Years | 0.051 [0.051 - 0.051] * | * | 0.051 | 1 * | 0.031 |
| 100 Years | 0.218 [0.218 - 0.218] * | * | 0.218 | 1 * | 0.101 |
* forecast duration is longer than simulation length, only ETAS ruptures from the first 10 years are included
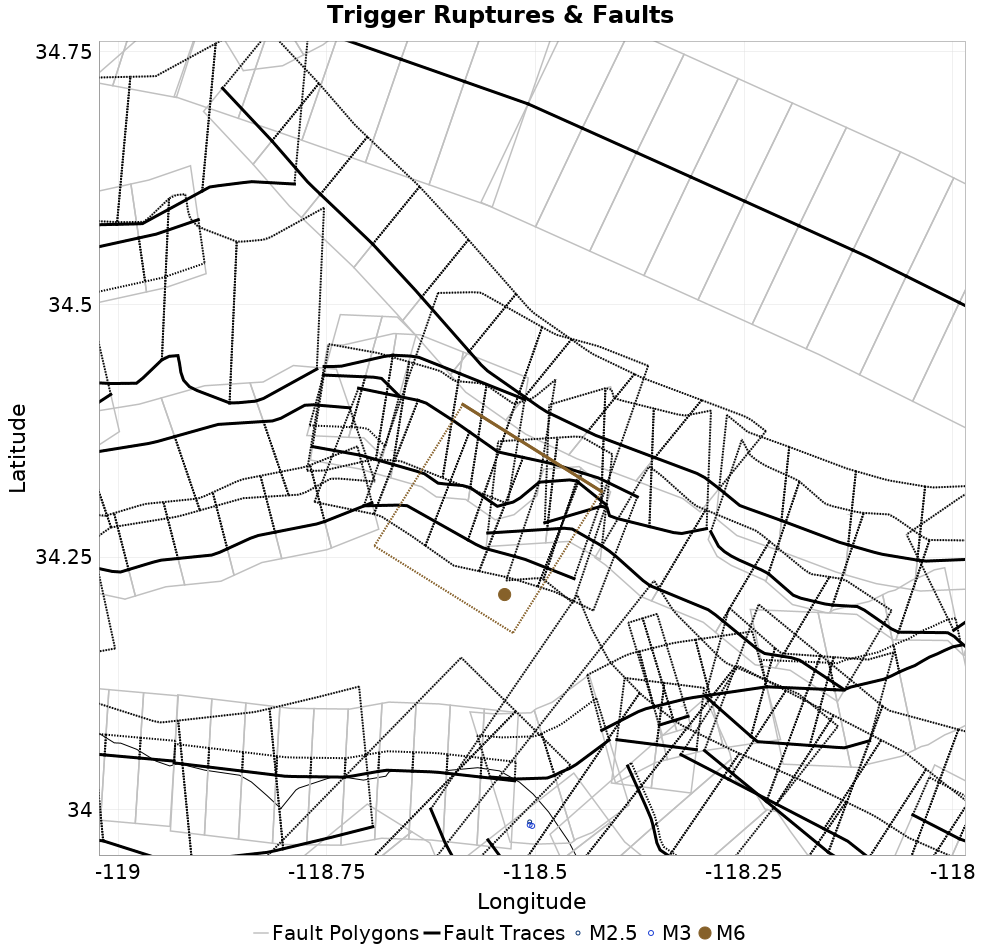
Trigger Rupture Fault Map
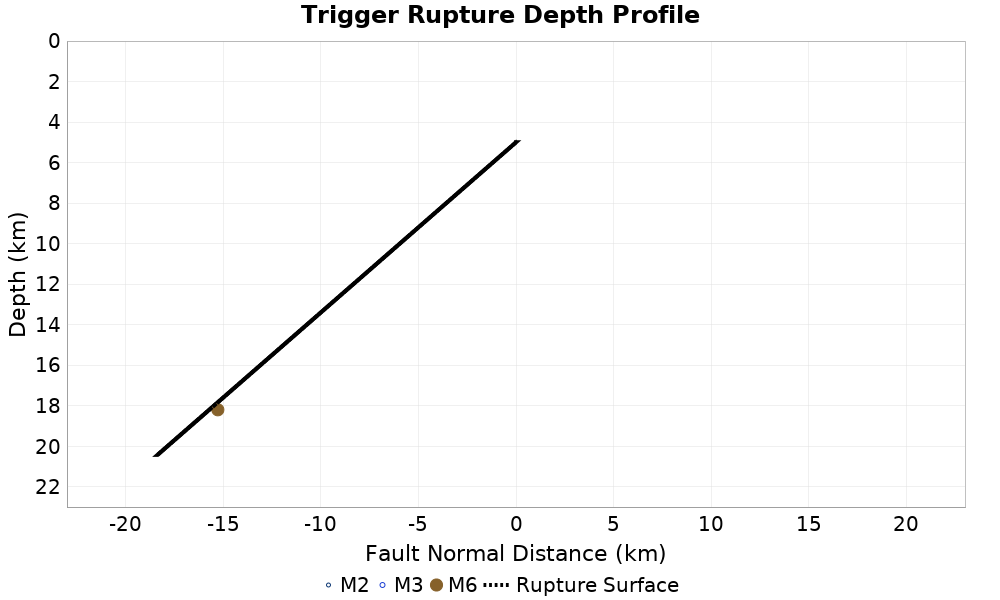
Trigger Rupture Depth Map
Fault Distances To Triggers
| Section Name | Strike, Dip, Rake | # Hypos In Poly | Max Mag w/ Hypo In Poly | # Surfs In Poly | Max Mag w/ Surf In Poly | Min Dist To Any (km) | Min Poly Dist To Any (km) | Min Dist To Largest (km) | Min Poly Dist To Largest (km) | Min Hypo Dist To Largest (km) | Min Hypo Poly Dist To Largest (km) |
|---|---|---|---|---|---|---|---|---|---|---|---|
| Compton | 305, 20, 85 | 3 | 3.57 | 3 | 3.57 | 2.019 | 0.000 | 3.770 | 3.498 | 7.745 | 6.637 |
| San Pedro Escarpment | 308, 17, 84 | 3 | 3.57 | 3 | 3.57 | 3.180 | 0.000 | 9.434 | 8.655 | 13.146 | 11.985 |
| Palos Verdes | 313, 90, 173 | 3 | 3.57 | 3 | 3.57 | 4.709 | 0.000 | 23.938 | 16.825 | 27.449 | 21.075 |
| Santa Monica alt 1 | 253, 75, 24 | 3 | 3.57 | 3 | 3.57 | 5.192 | 0.000 | 11.547 | 8.699 | 15.202 | 12.643 |
| Holser alt 1 | 99, 58, 99 | 0 | 1 | 6.7 | 0.107 | 0.000 | 0.107 | 0.000 | 10.002 | 9.994 | |
| Santa Susana alt 1 | 278, 55, 45 | 0 | 1 | 6.7 | 0.160 | 0.000 | 0.160 | 0.000 | 18.345 | 8.291 | |
| Northridge | 111, 35, 101 | 0 | 1 | 6.7 | 0.174 | 0.000 | 0.174 | 0.000 | 2.407 | 1.917 | |
| Santa Susana East (connector) | 108, 55, 85 | 0 | 1 | 6.7 | 0.180 | 0.000 | 0.180 | 0.000 | 2.458 | 1.556 | |
| Mission Hills 2011 | 277, 55, 84 | 0 | 1 | 6.7 | 0.192 | 0.000 | 0.192 | 0.000 | 15.995 | 5.392 | |
| Northridge Hills | 289, 31, 83 | 0 | 1 | 6.7 | 0.221 | 0.000 | 0.221 | 0.000 | 17.837 | 4.340 | |
| Sierra Madre (San Fernando) | 273, 45, 81 | 0 | 1 | 6.7 | 0.308 | 0.000 | 0.308 | 0.000 | 19.022 | 9.048 | |
| Verdugo | 301, 55, 79 | 0 | 0 | 3.148 | 3.095 | 3.148 | 3.095 | 19.778 | 10.738 | ||
| Santa Monica Bay | 314, 20, 91 | 0 | 0 | 3.740 | 1.172 | 5.864 | 5.339 | 8.435 | 8.433 | ||
| Oak Ridge (Onshore) | 71, 65, 91 | 0 | 0 | 4.800 | 3.707 | 4.800 | 3.707 | 18.970 | 18.931 | ||
| Malibu Coast alt 1 | 273, 75, 24 | 0 | 0 | 5.230 | 1.903 | 18.902 | 8.664 | 20.932 | 12.758 | ||
| Del Valle | 106, 73, 110 | 0 | 0 | 5.525 | 4.462 | 5.525 | 4.462 | 20.938 | 20.277 | ||
| San Gabriel | 309, 61, 105 | 0 | 0 | 6.115 | 0.916 | 6.115 | 0.916 | 26.354 | 16.912 | ||
| Simi-Santa Rosa | 255, 60, 19 | 0 | 0 | 7.256 | 0.817 | 7.256 | 0.817 | 23.334 | 15.617 | ||
| Hollywood | 255, 70, 22 | 0 | 0 | 9.667 | 9.412 | 9.667 | 9.412 | 12.731 | 12.699 | ||
| North Salt Lake | 253, 54, 90 | 0 | 0 | 10.392 | 10.179 | 10.392 | 10.179 | 14.049 | 13.969 | ||
| Newport-Inglewood alt 1 | 320, 88, 175 | 0 | 0 | 12.470 | 2.176 | 20.112 | 19.362 | 23.418 | 23.136 | ||
| Sierra Madre | 288, 53, 78 | 0 | 0 | 13.108 | 12.821 | 13.108 | 12.821 | 29.250 | 23.220 | ||
| San Vicente | 277, 66, 79 | 0 | 0 | 13.134 | 9.945 | 13.134 | 13.063 | 16.138 | 16.093 | ||
| San Gabriel (Extension) | 280, 61, -175 | 0 | 0 | 13.421 | 12.843 | 13.421 | 12.843 | 30.688 | 24.730 | ||
| Anacapa-Dume alt 1 | 264, 45, 44 | 0 | 0 | 14.855 | 14.015 | 14.855 | 14.015 | 19.164 | 18.973 | ||
| San Cayetano | 273, 42, 89 | 0 | 0 | 17.232 | 15.679 | 17.232 | 15.679 | 37.063 | 32.279 | ||
| Elysian Park (Lower CFM) | 303, 22, 87 | 0 | 0 | 18.213 | 18.193 | 22.930 | 22.820 | 26.566 | 25.876 | ||
| Elysian Park (Upper) | 285, 50, 87 | 0 | 0 | 19.419 | 18.714 | 19.419 | 18.714 | 24.972 | 24.255 |
Individual Simulated Catalog Maps
These are map plots of individual catalogs from the simulations, selected as the closest catalog to each of the given percentiles in terms of total number of events.
| Duration | p0.0 %-ile | p25.0 %-ile | p50.0 %-ile | p75.0 %-ile | p90.0 %-ile | p95.0 %-ile | p97.5 %-ile | p98.0 %-ile | p99.0 %-ile | p99.5 %-ile | p99.9 %-ile | p99.999 %-ile |
|---|---|---|---|---|---|---|---|---|---|---|---|---|
| 1 Week | 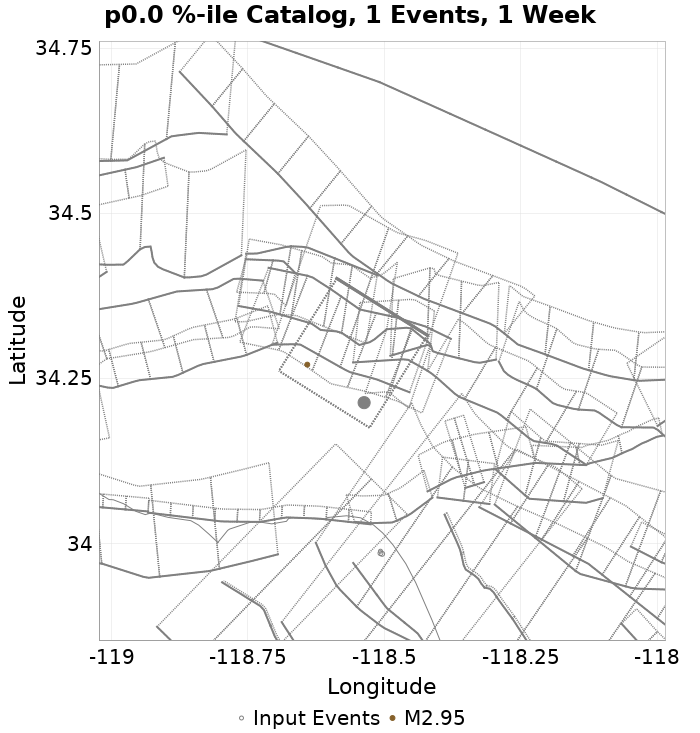 | 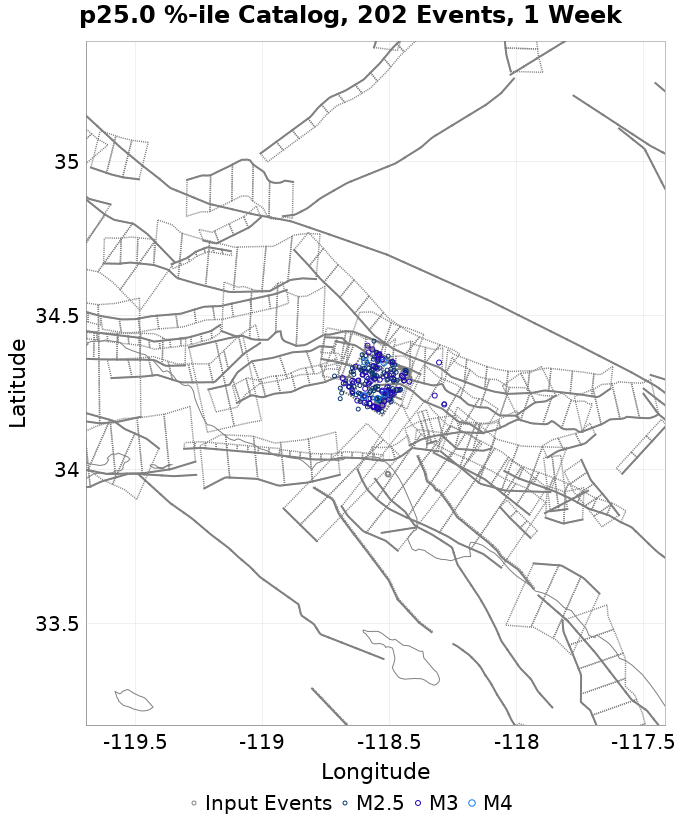 | 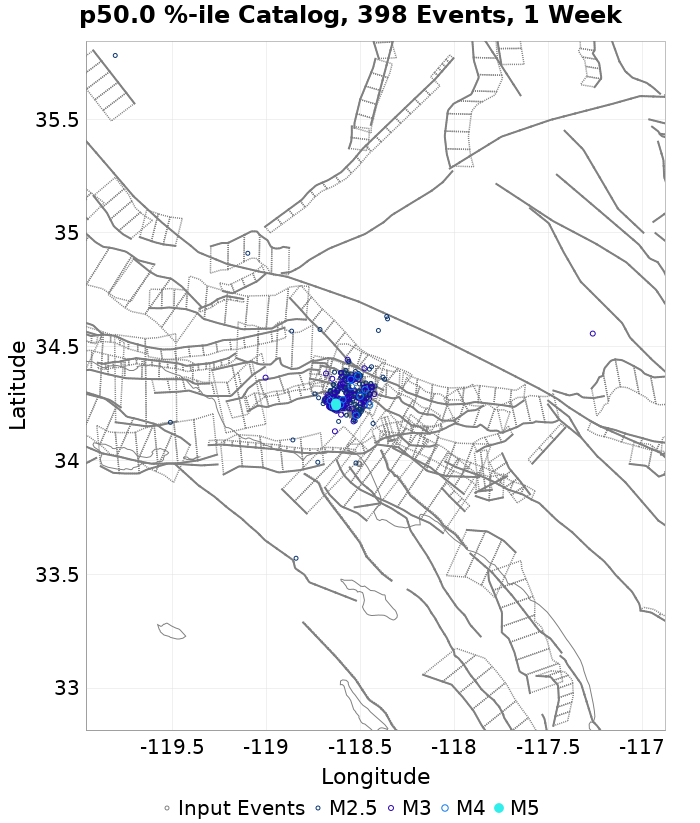 | 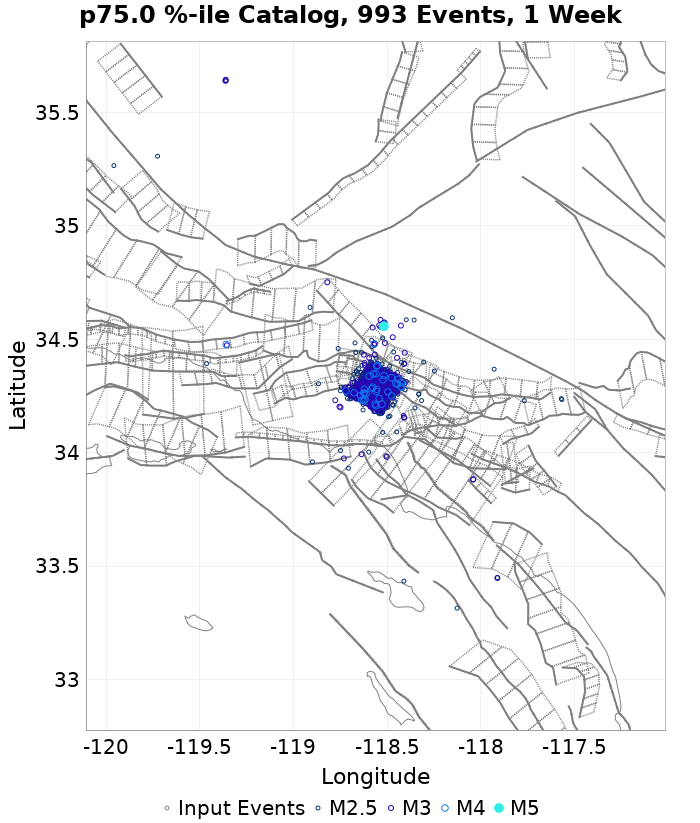 | 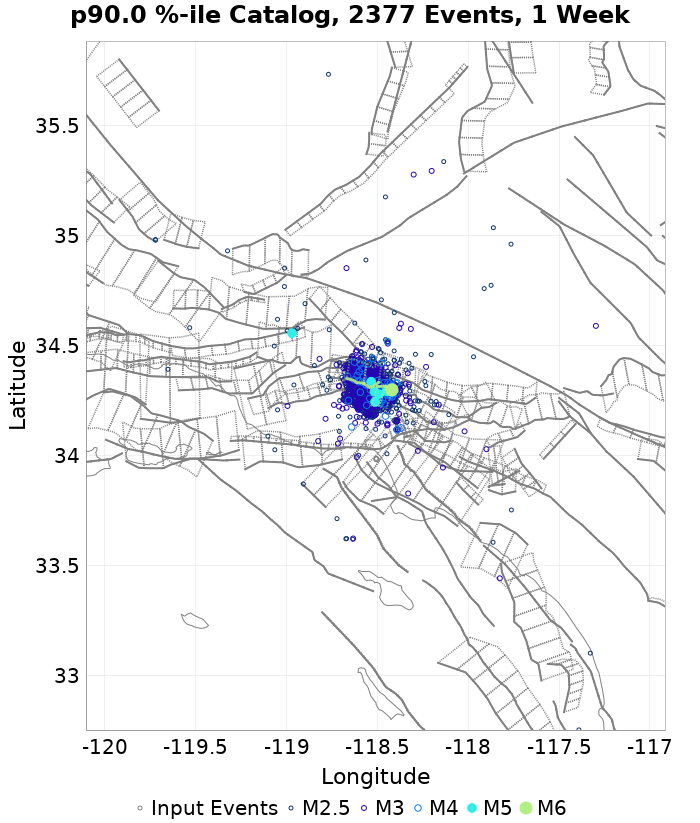 |  |  | 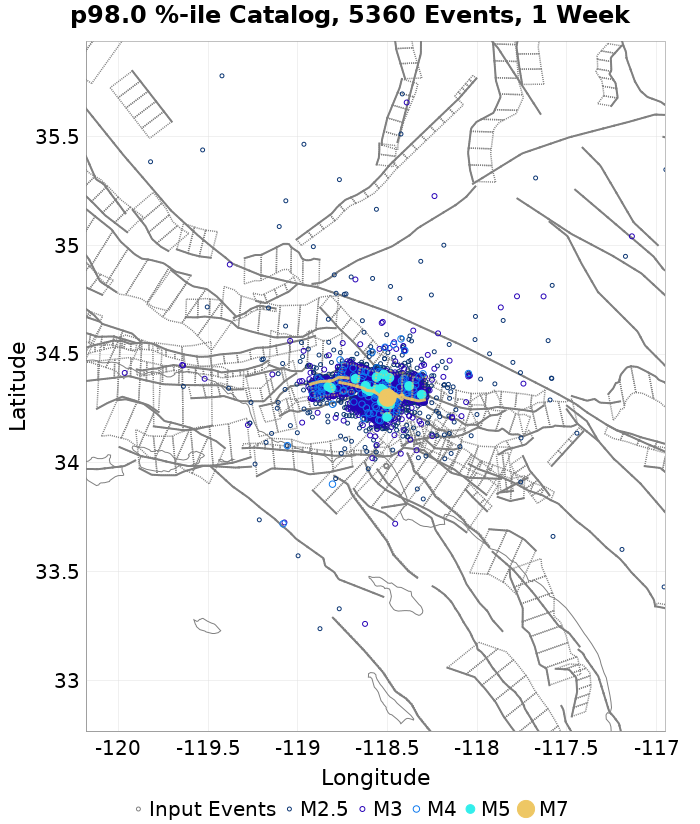 |  | 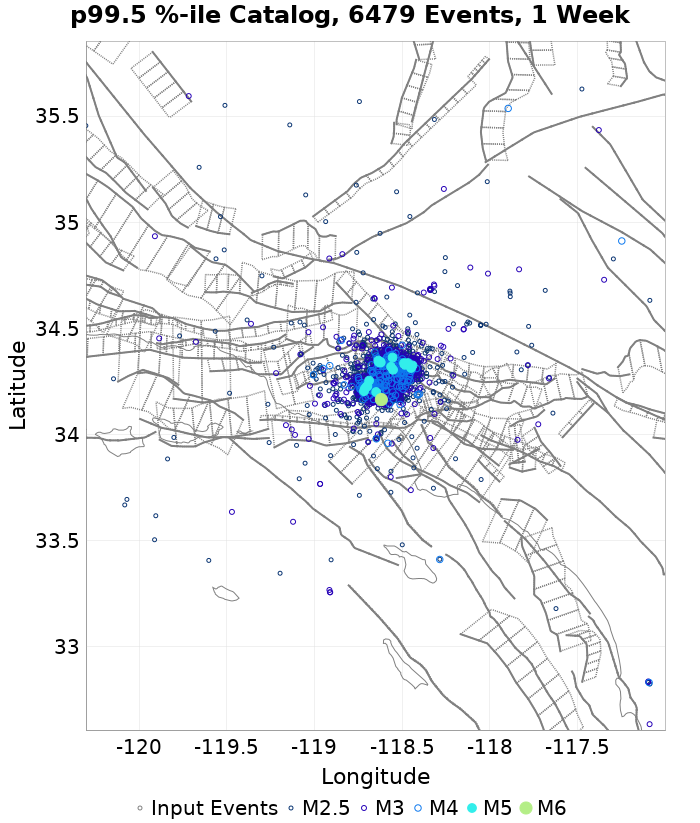 |  | 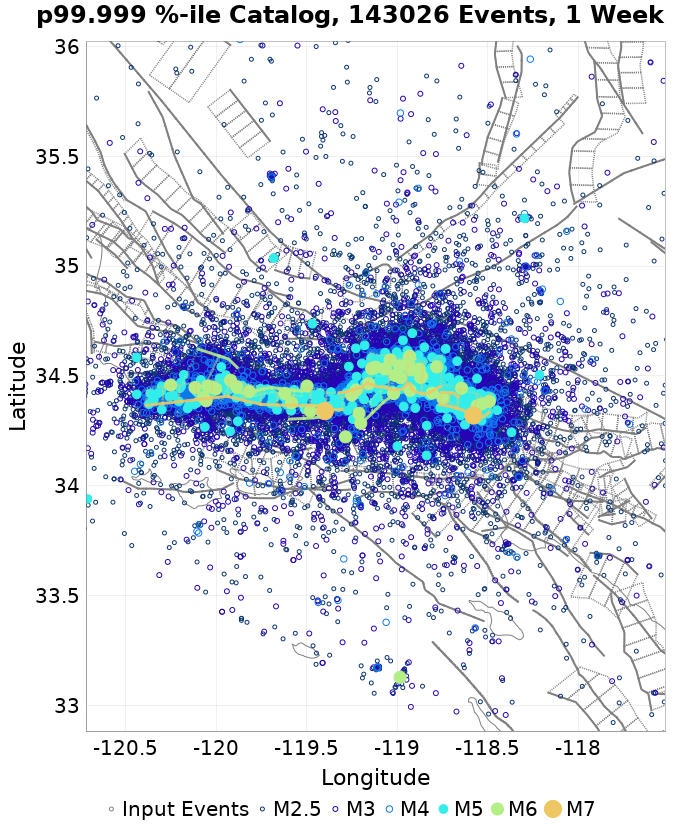 |
| 1 Month | 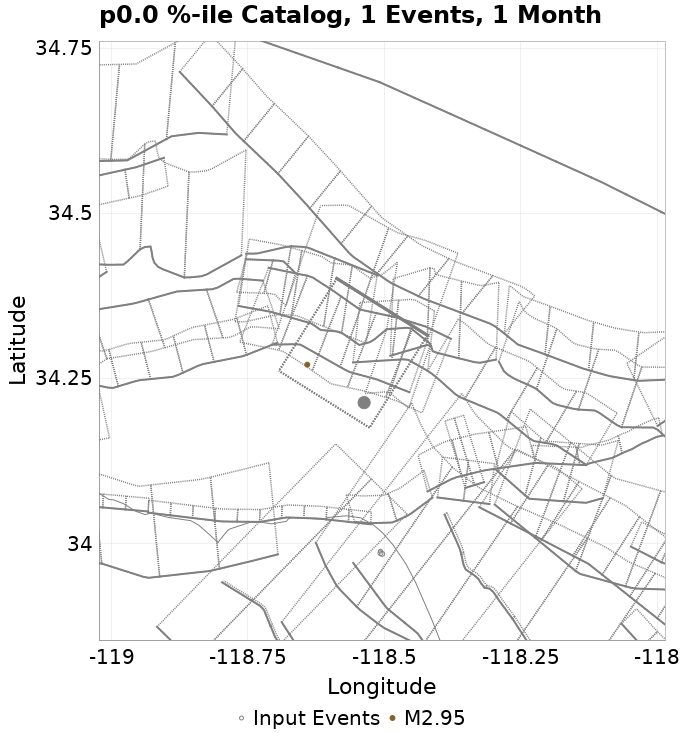 |  | 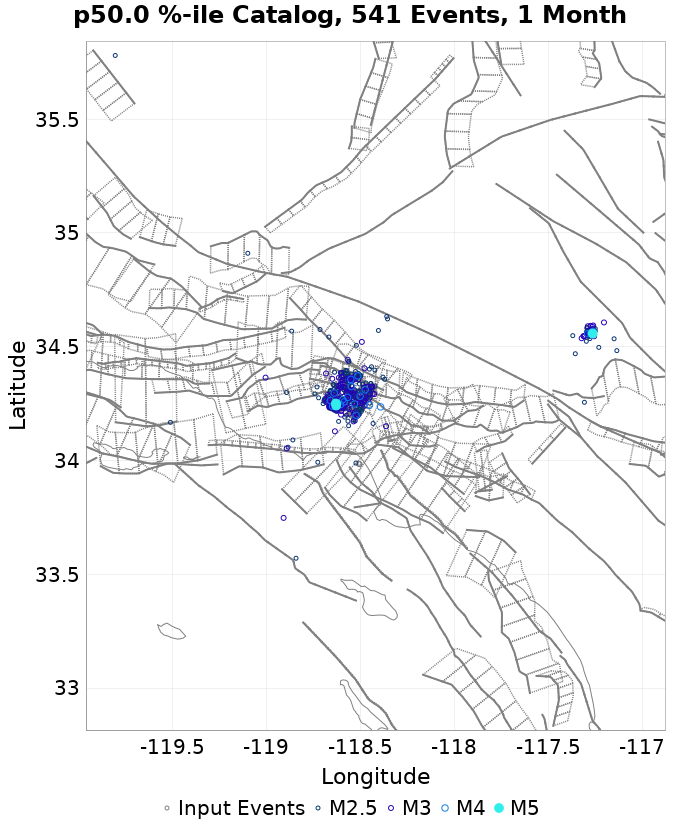 | 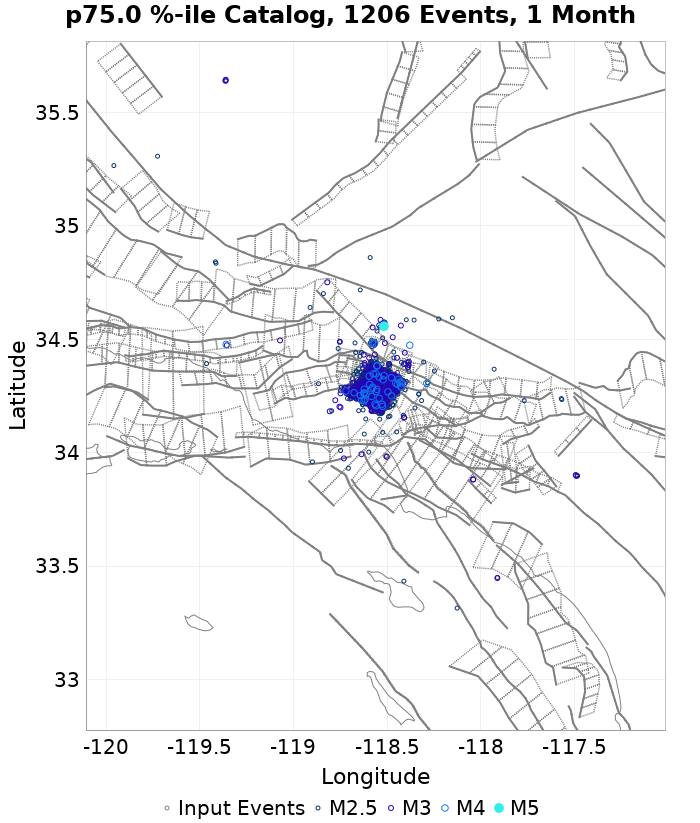 | 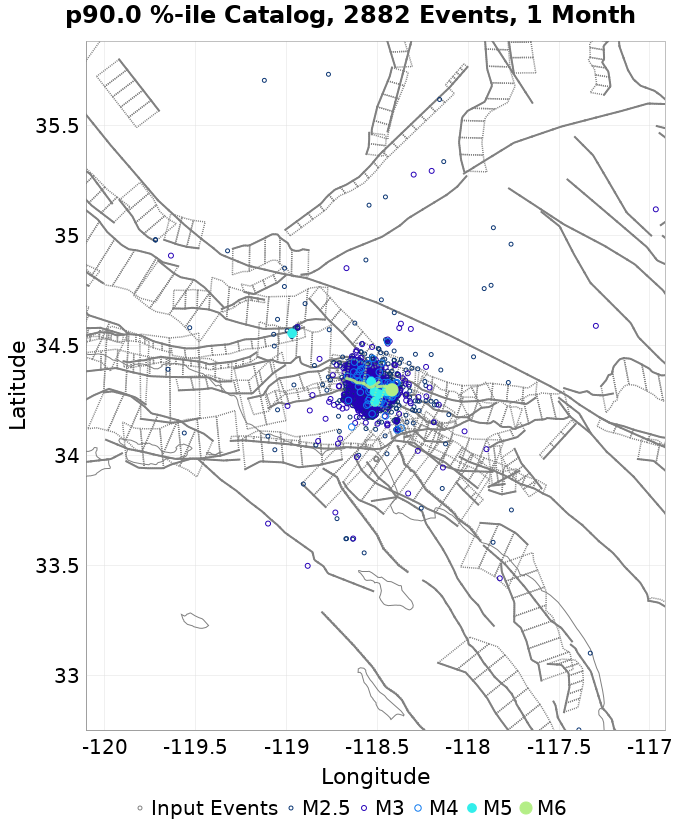 |  | 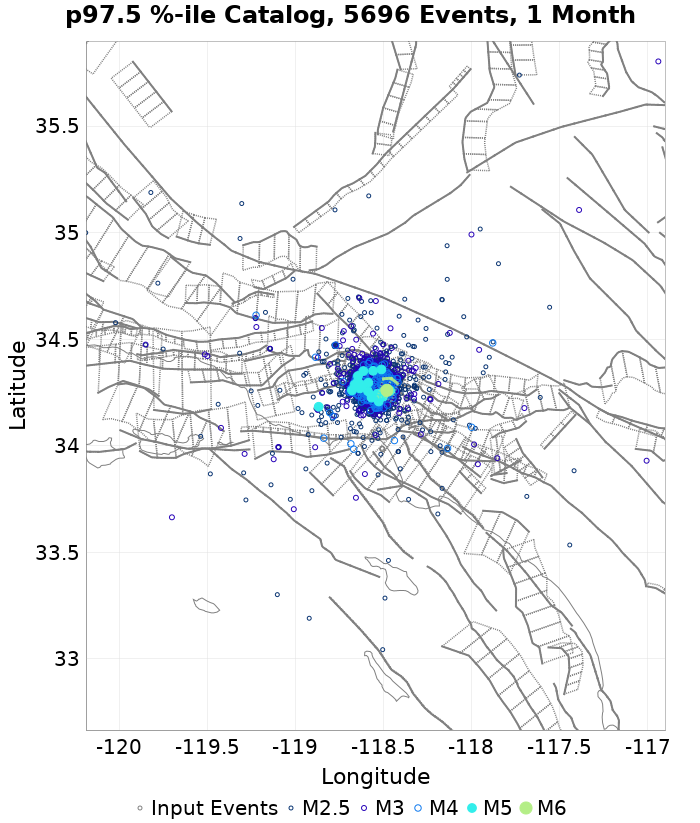 | 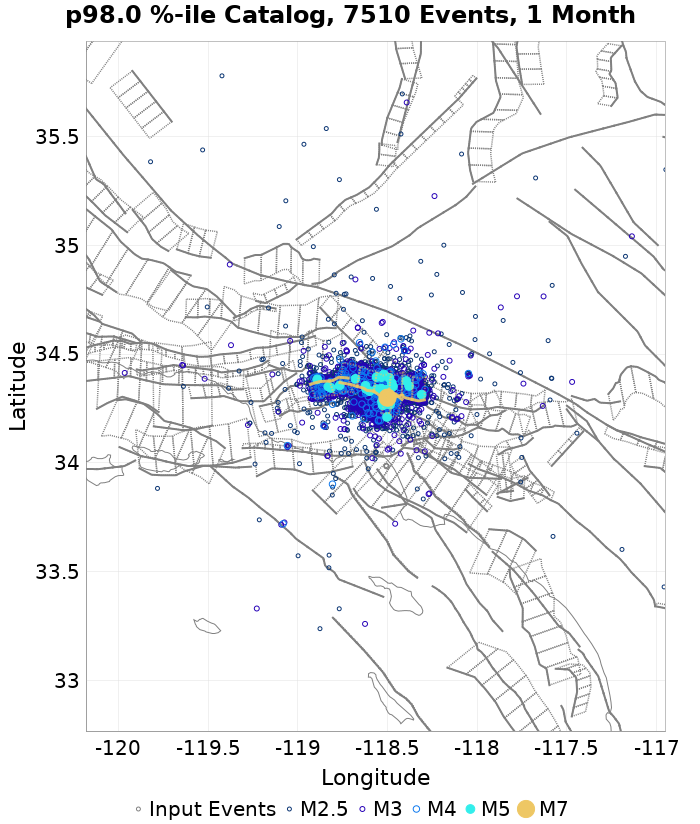 |  | 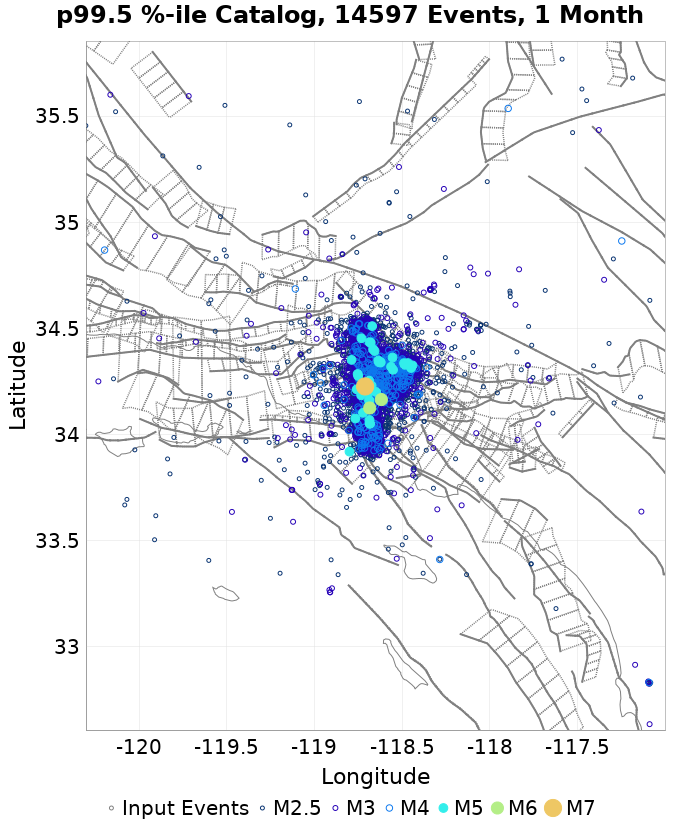 | 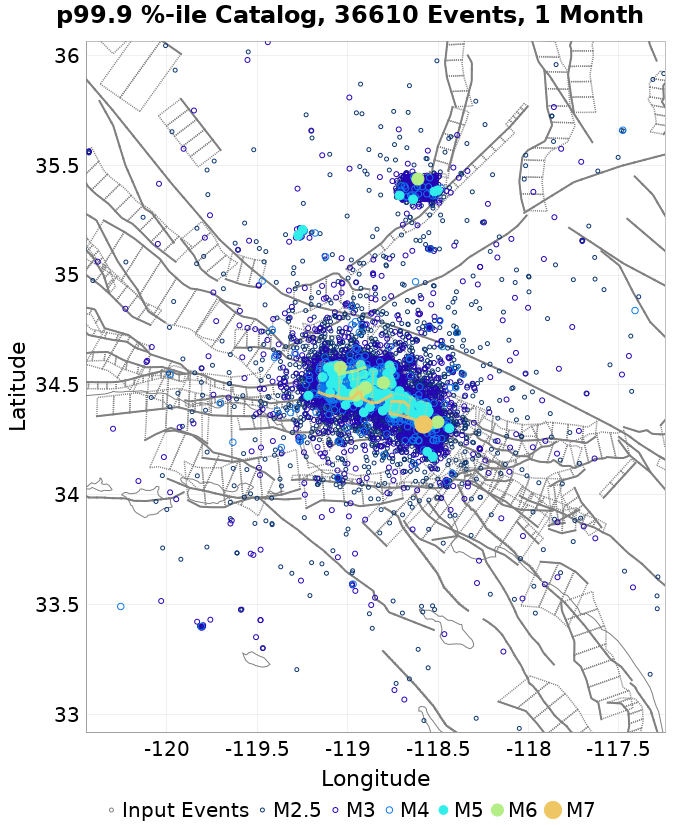 | 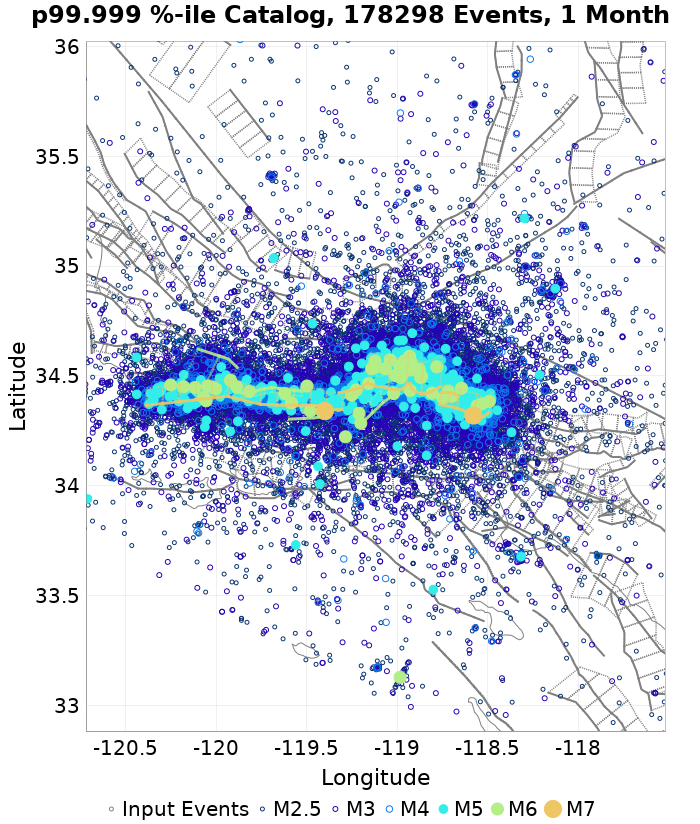 |
| 1 Year | 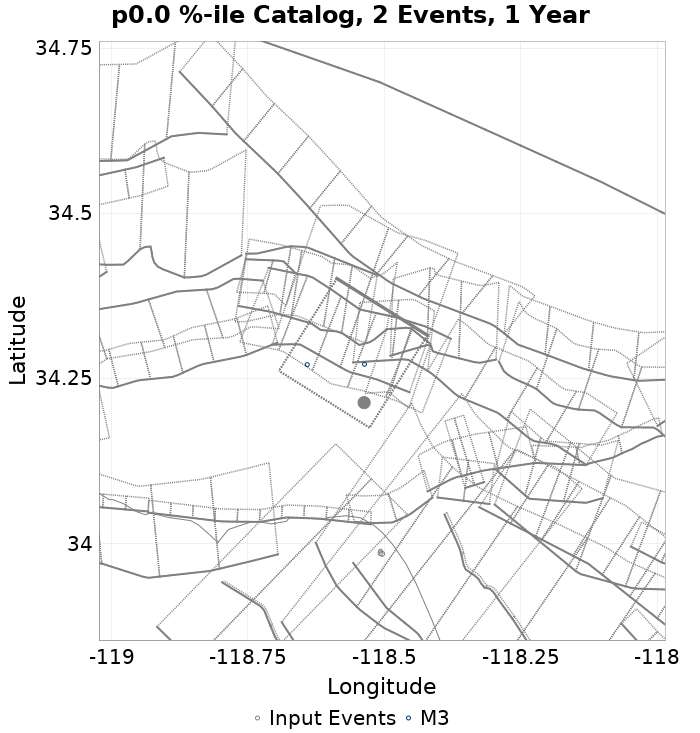 | 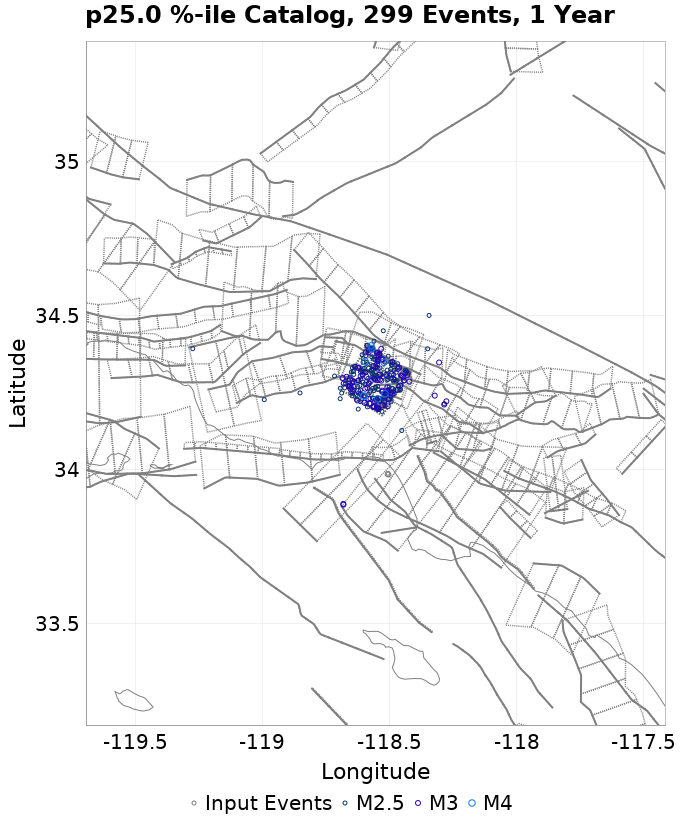 | 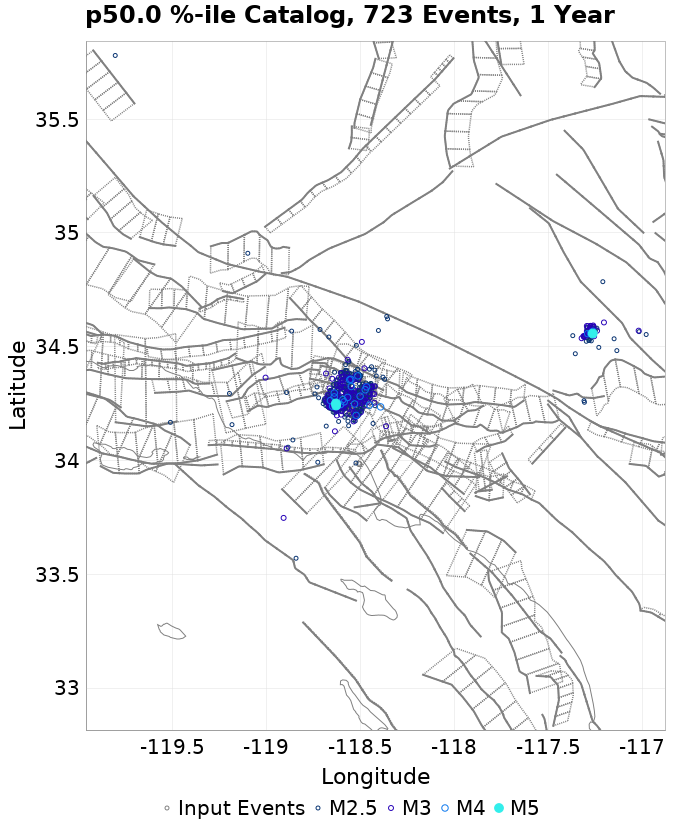 | 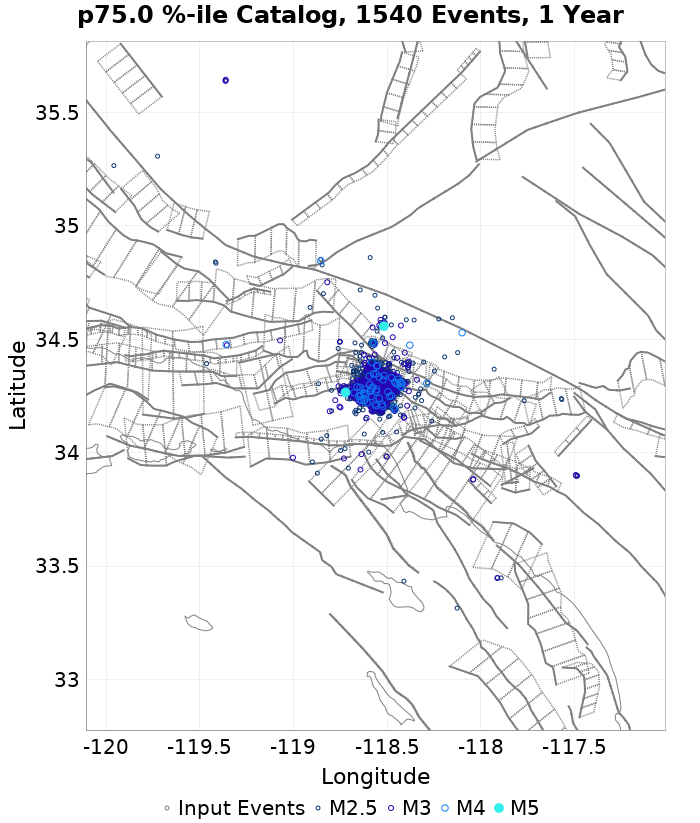 | 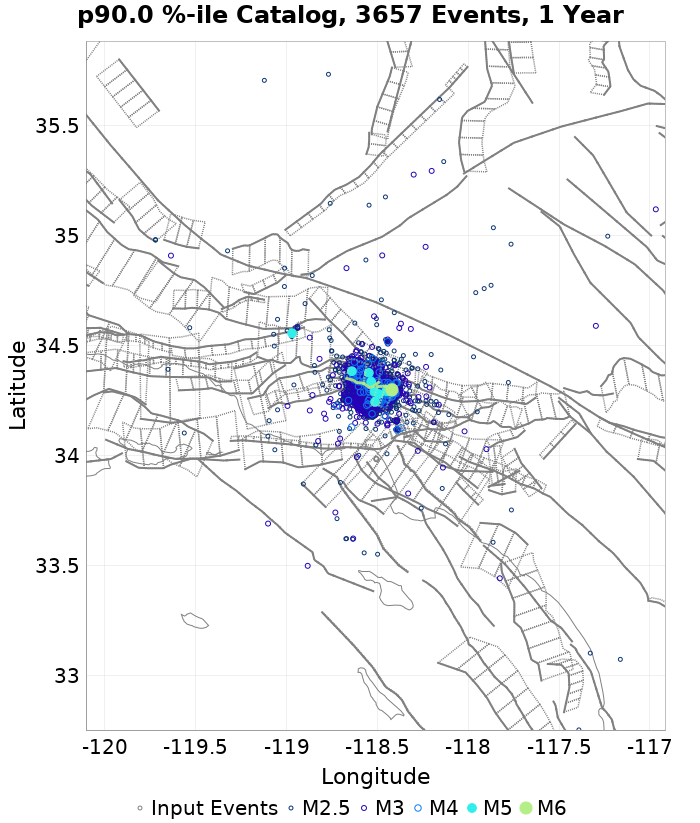 |  |  |  | 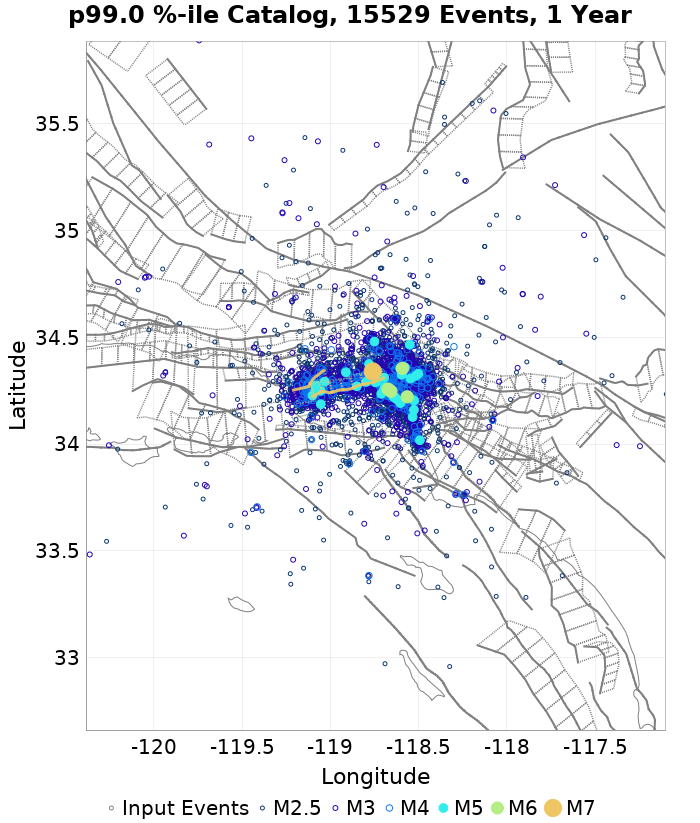 | 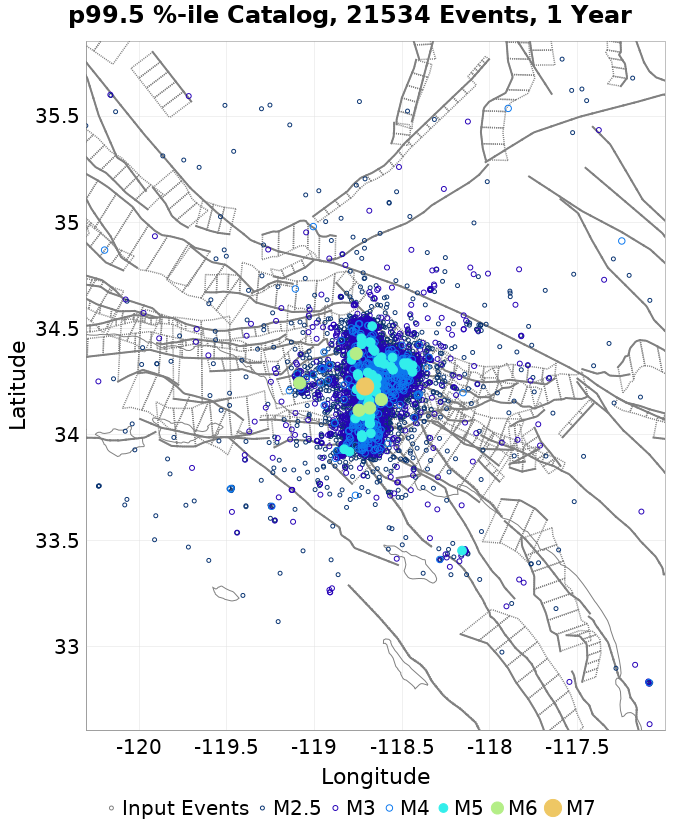 |  | 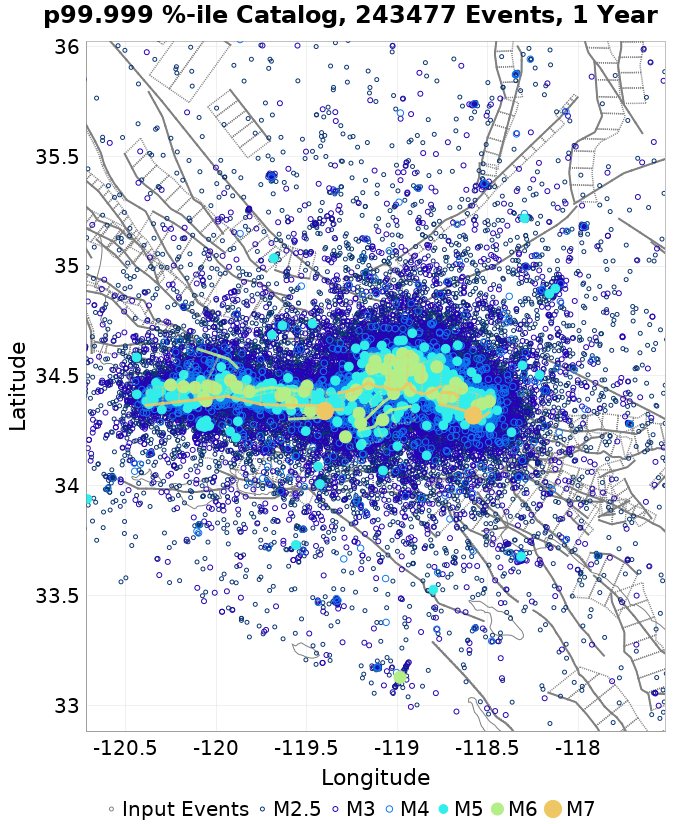 |
| 10 Year | 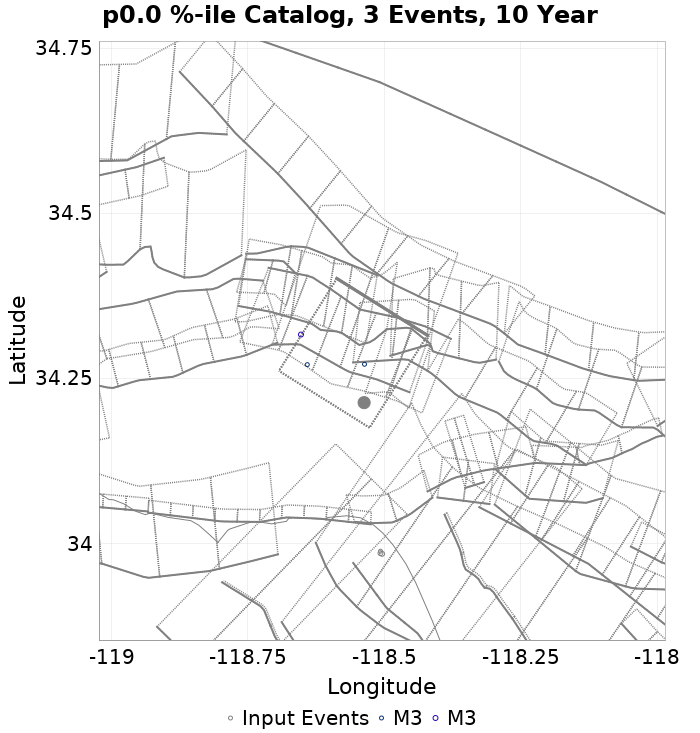 | 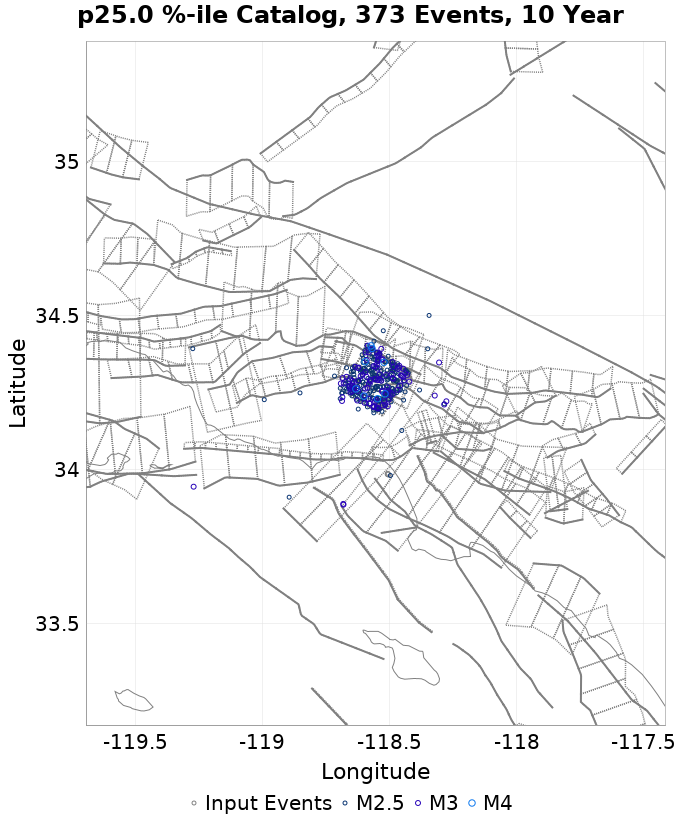 | 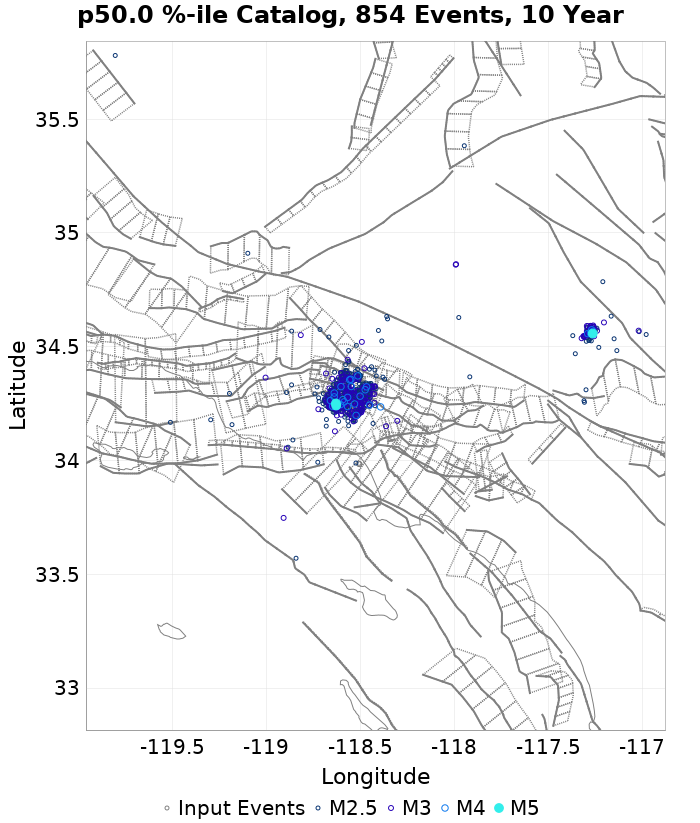 | 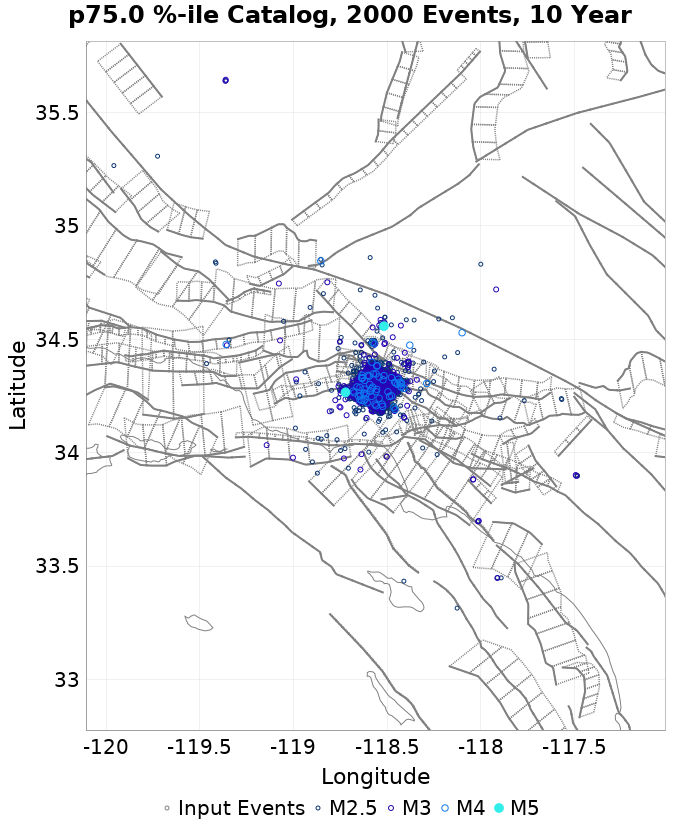 |  |  |  |  |  |  | 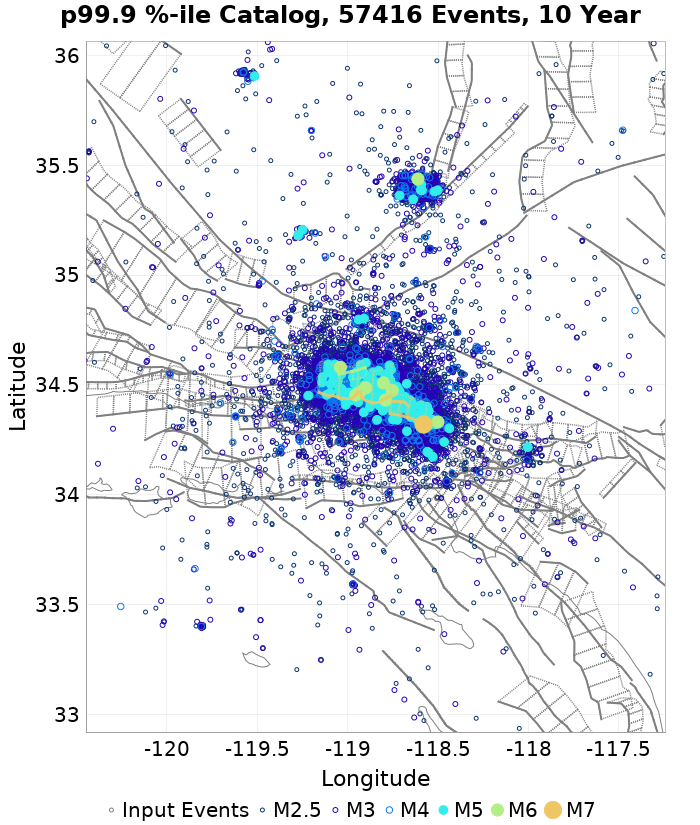 | 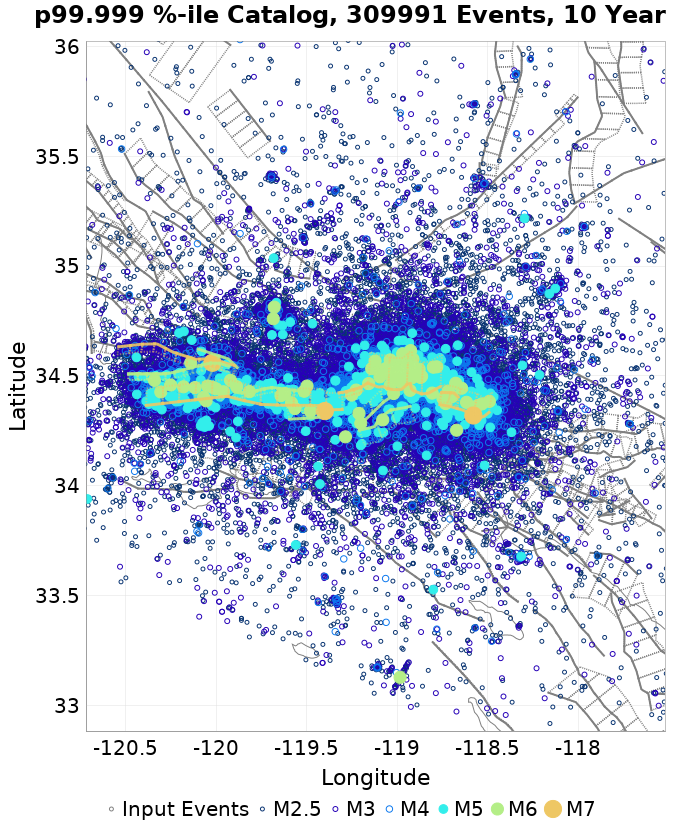 |
ComCat Data Comparisons
These plots compare simulated sequences with data from ComCat. All plots only consider events with hypocenters inside the ComCat region defined in the JSON input file.
Last updated at 2024/10/18 06:34:42 UTC, 30.8 years after the simulation start time.
Total matching ComCat events found: 1362
ComCat Magnitude-Number Distributions
| Incremental MND | Cumulative MND |
|---|---|
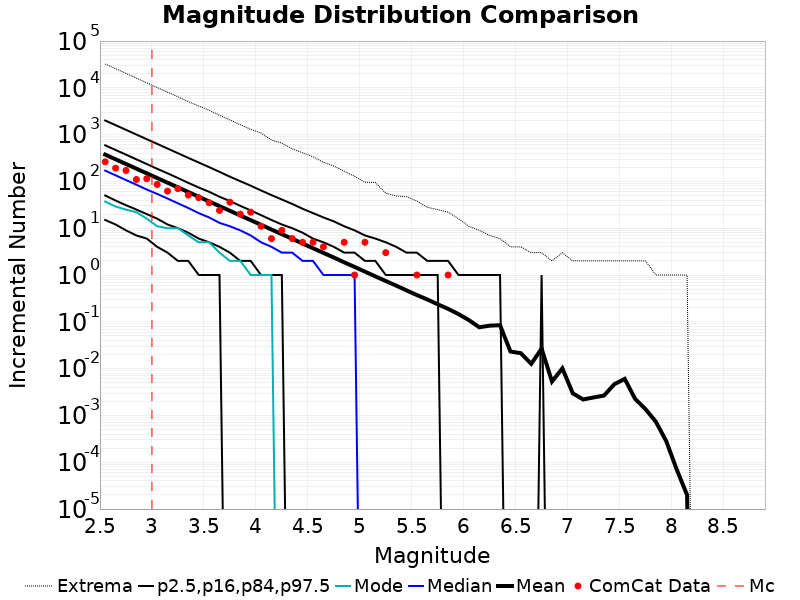 | 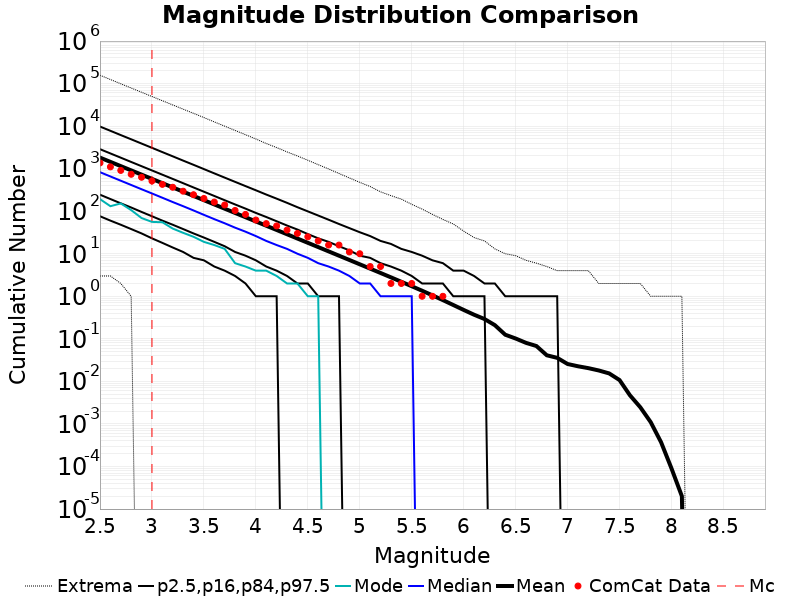 |
ComCat Magnitude-Time Functions
These plots show the show the magnitude versus time probability function since simulation start. Observed event data lie on top, with those input to the simulation plotted as magenta circles and those that occurred after the simulation start time as cyan circles. Time is relative to the mainshock (M6.7, ci3144585, plotted as a brown circle). Probabilities are only shown above the minimum simulated magnitude, M=2.5.
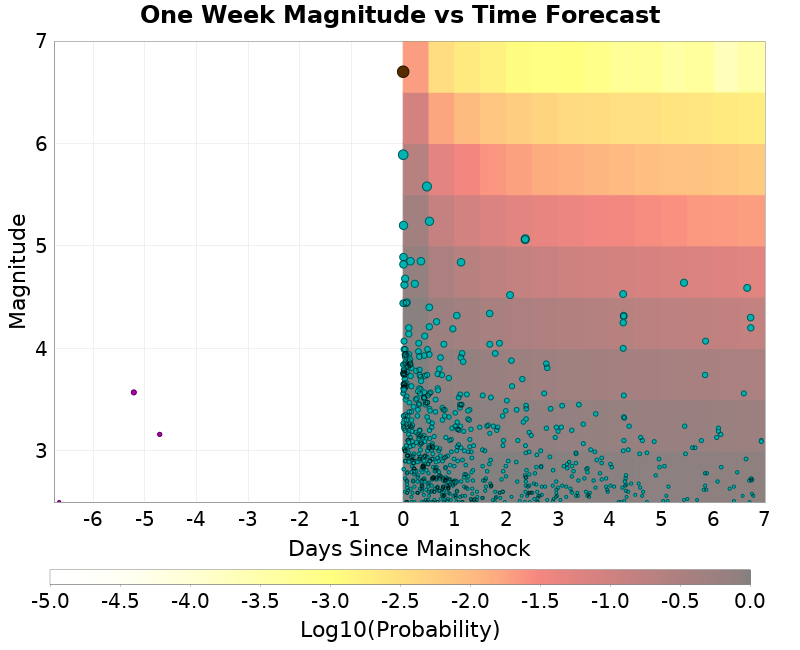 |
|---|
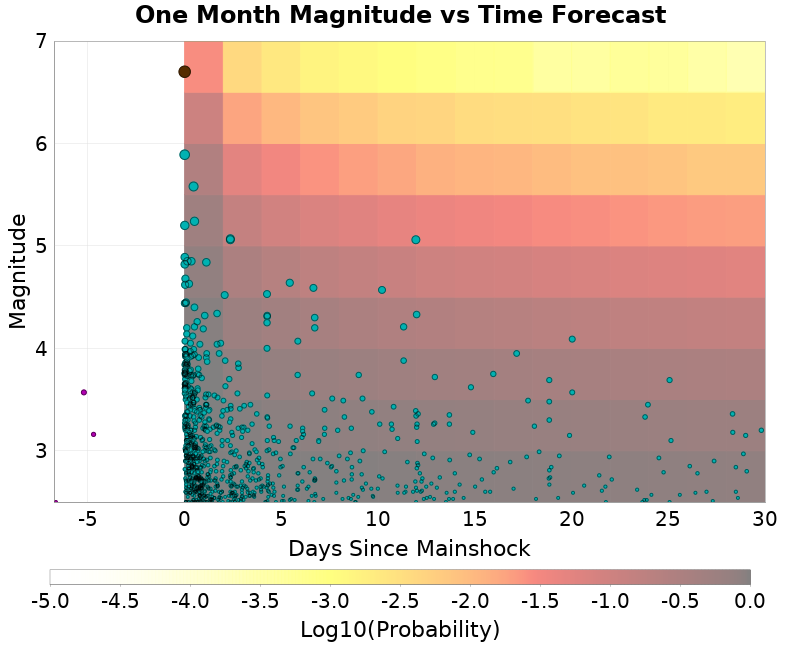 |
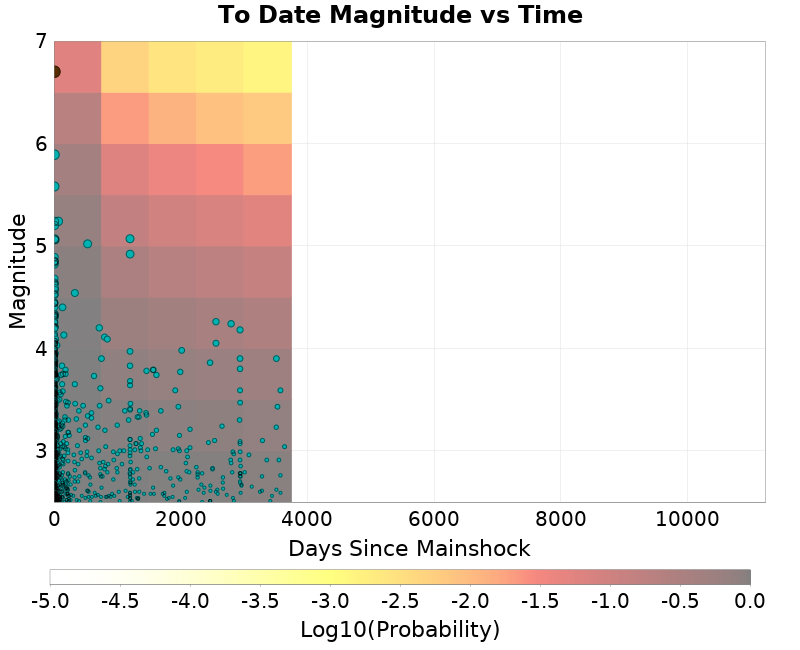 |
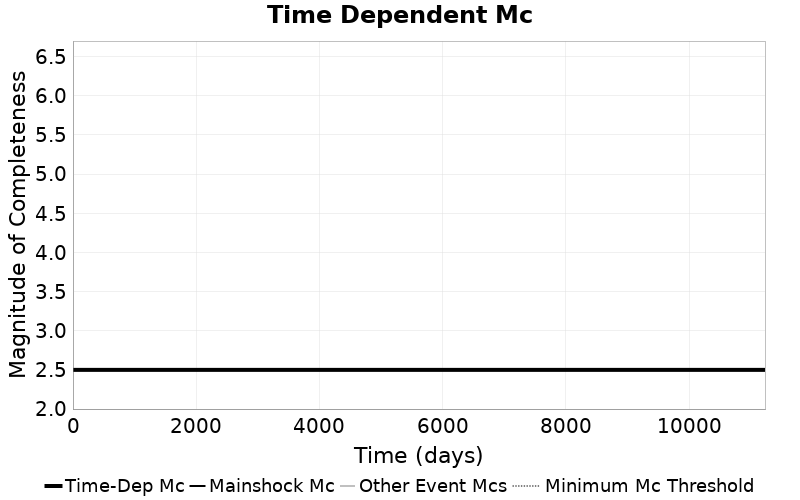
ComCat Time-Dependent Mc
The following plots compare simulation results with ComCat data above a magnitude threshold. Plots labeled as M≥Mc(t) use the time-dependent magnitude of completeness (Mc) defined in Helmstetter et al. (2006), which is plotted below. In the case of multiple M≥5 ruptures, either as input to the simulation or in the comparison data, the maximum calculated time-dependent Mc is used. This time-dependent Mc function is plotted below.
ComCat Cumulative Number Vs Time
| M≥Mc(t) | M≥3 | M≥4 | M≥5 | M≥6 | M≥7 |
|---|---|---|---|---|---|
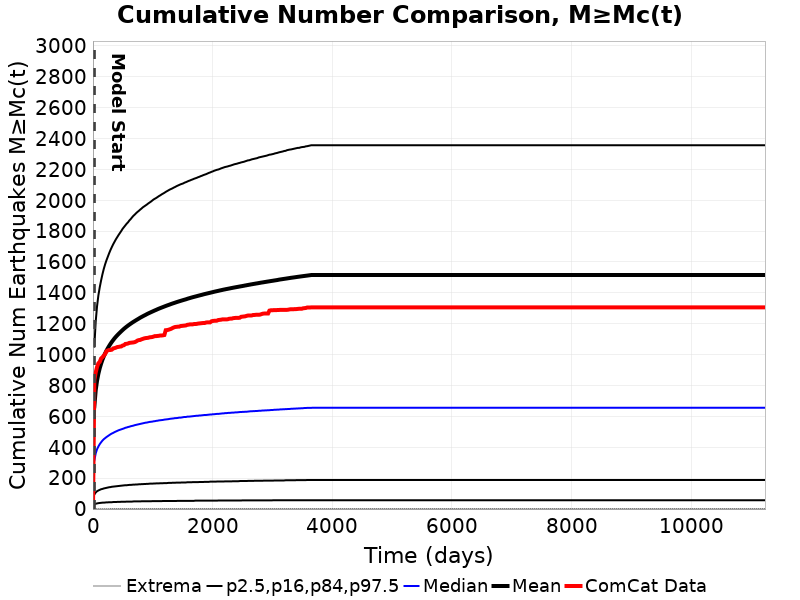 | 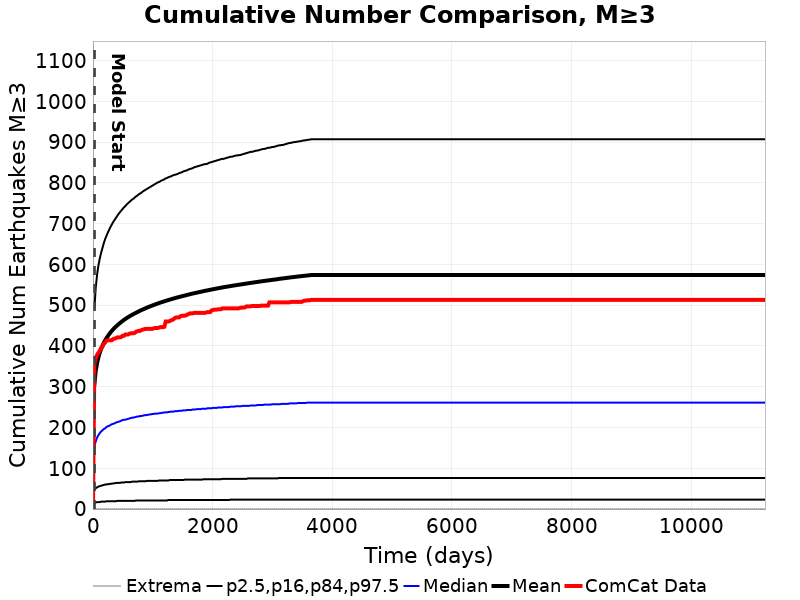 | 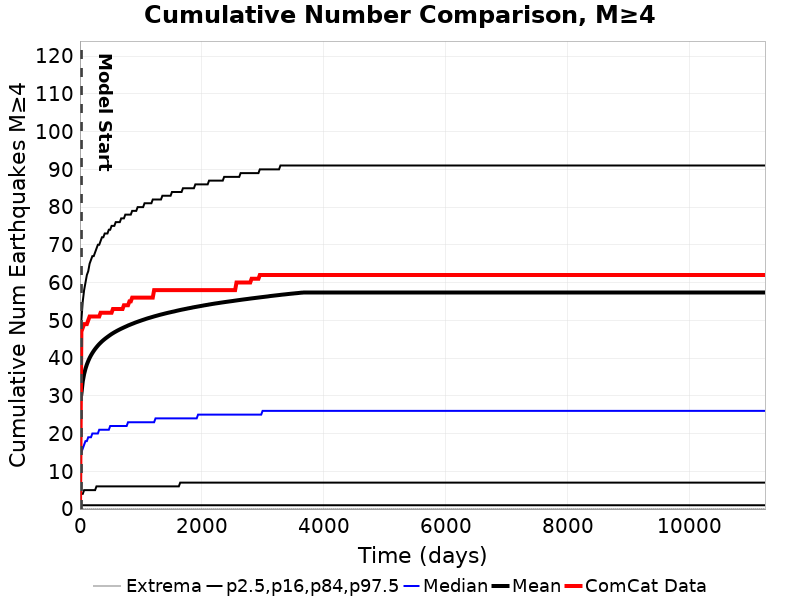 | 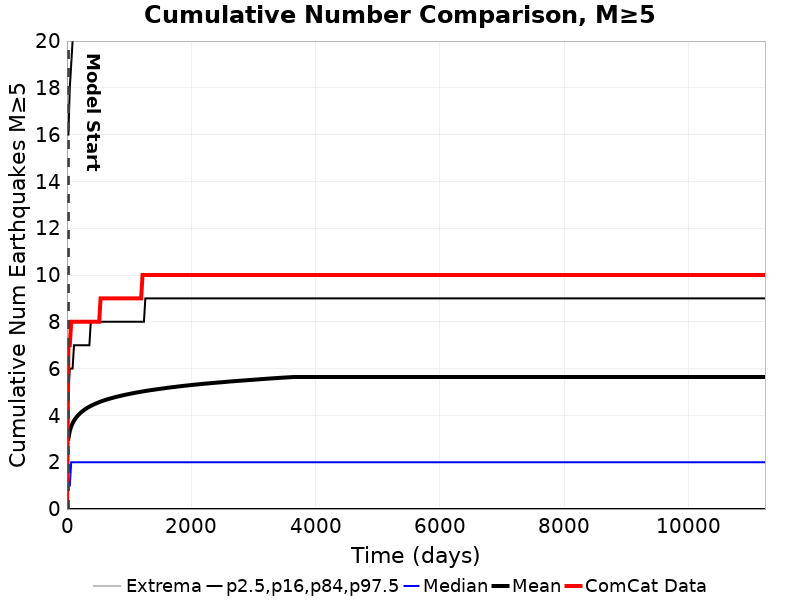 | 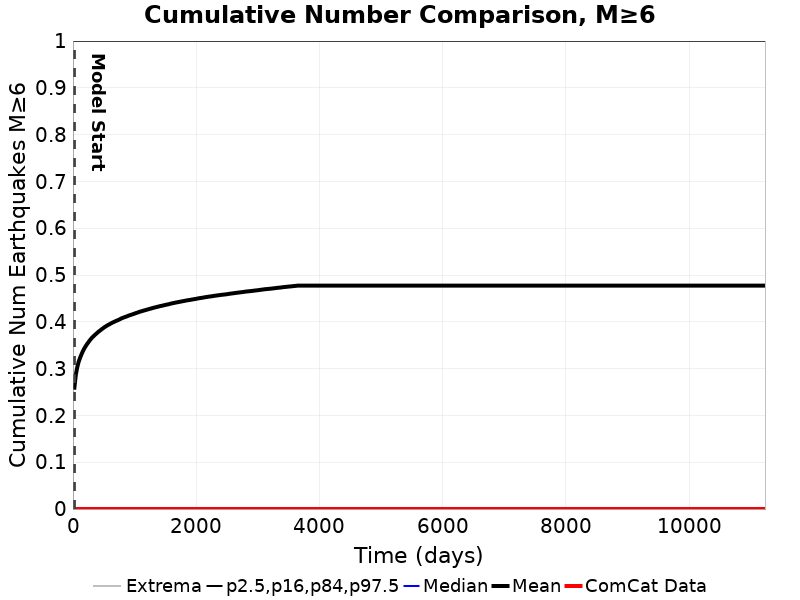 | 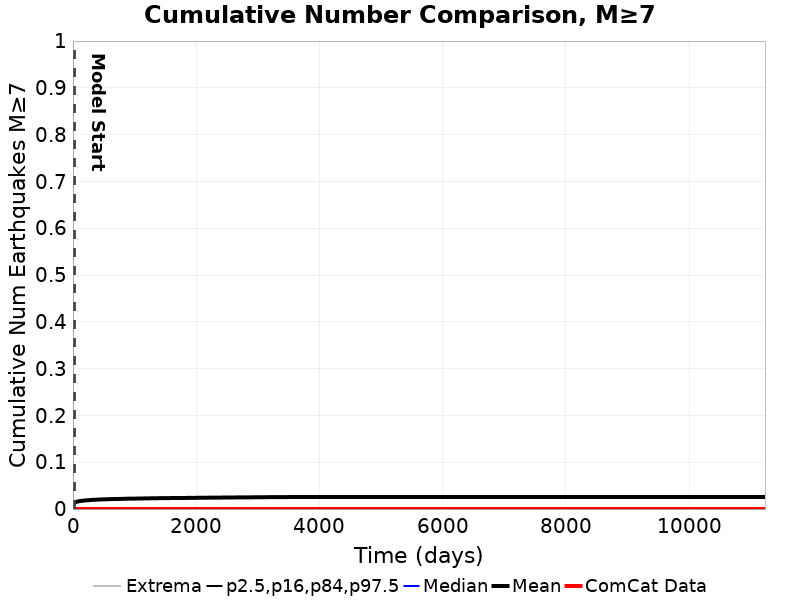 |
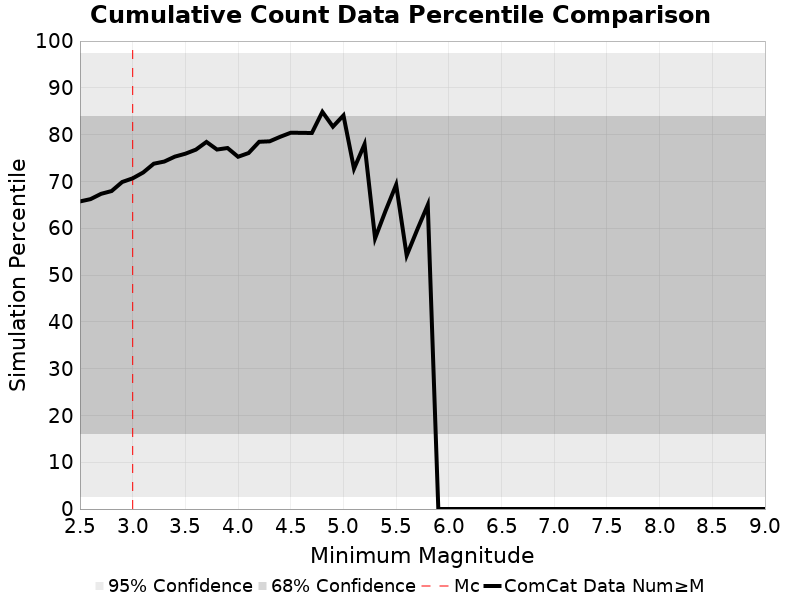
ComCat Cumulative Number Simulation Percentiles
ComCat Probability Spatial Distribution
| 1 Day | 1 Week | 1 Month | 1 Year | 10 Year | |
|---|---|---|---|---|---|
| M≥Mc(t) | 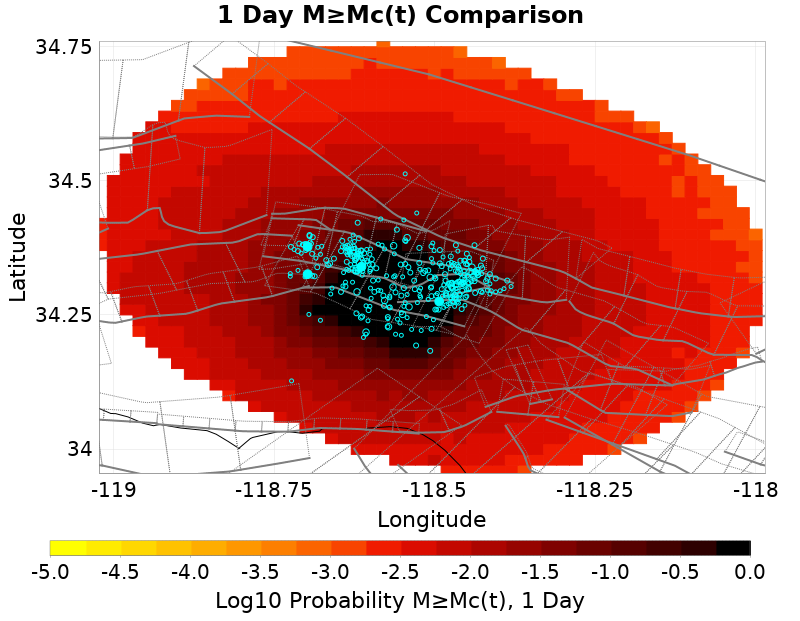 | 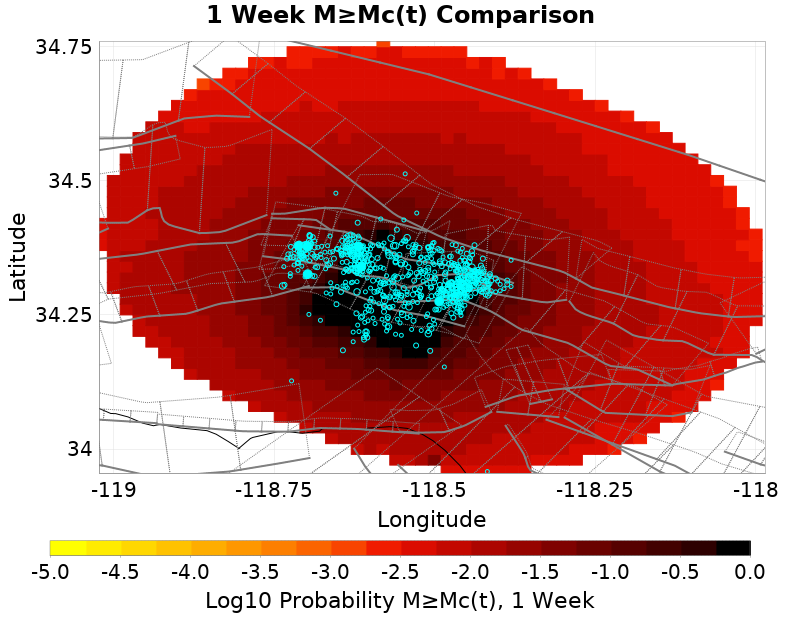 | 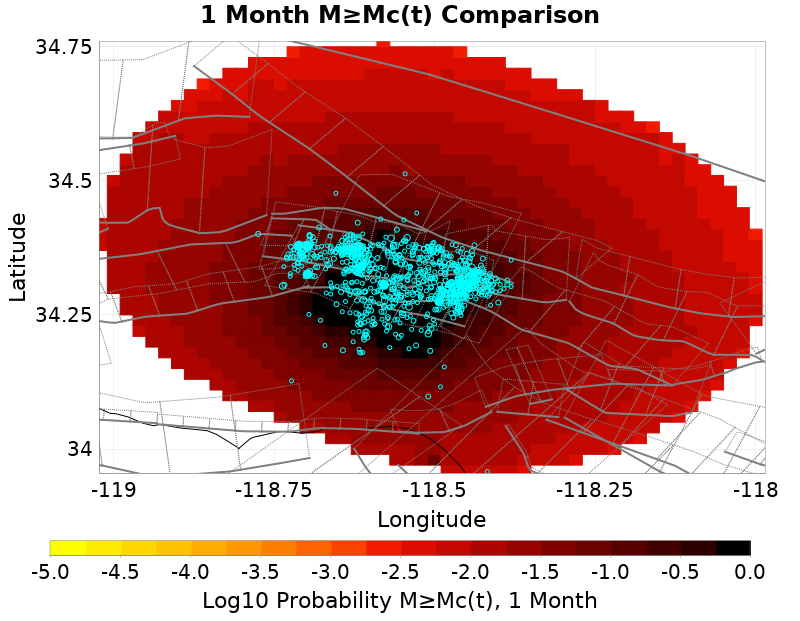 | 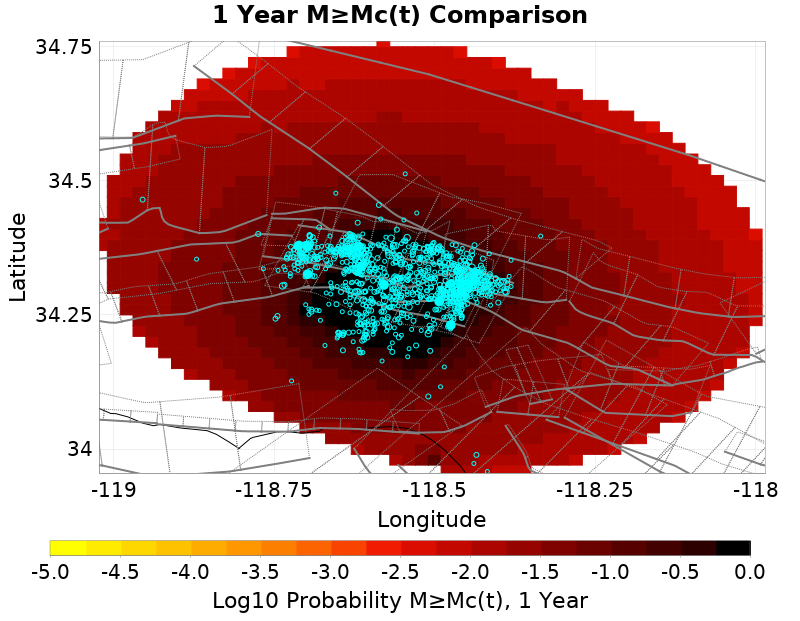 |  |
| Prob: 99.98%, Actual: 344 | Prob: 100.00%, Actual: 690 | Prob: 100.00%, Actual: 863 | Prob: 100.00%, Actual: 1043 | Prob: 100.00%, Actual: 1306 | |
| M≥3 |  | 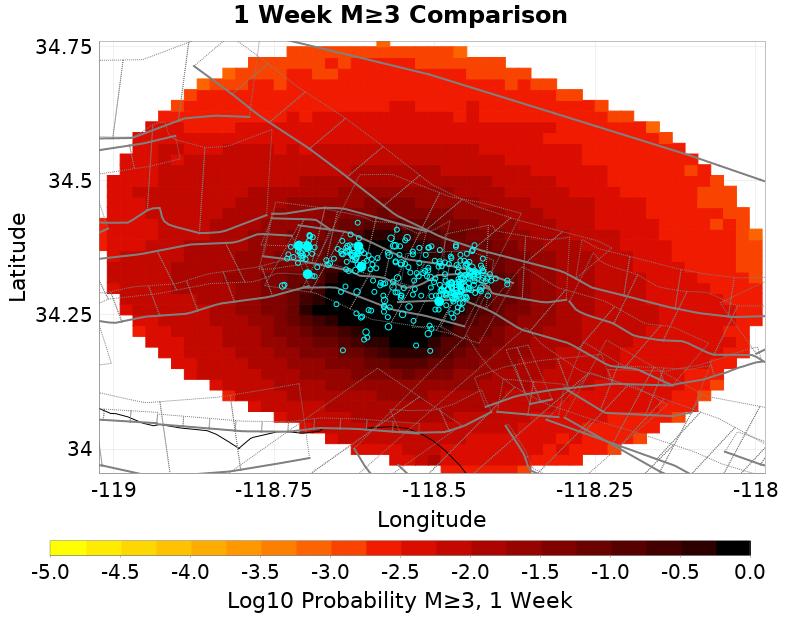 | 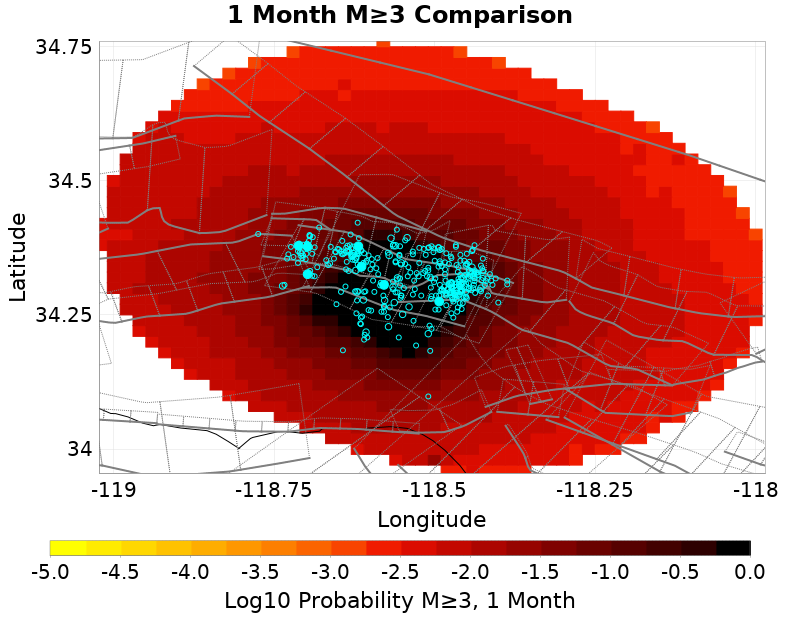 | 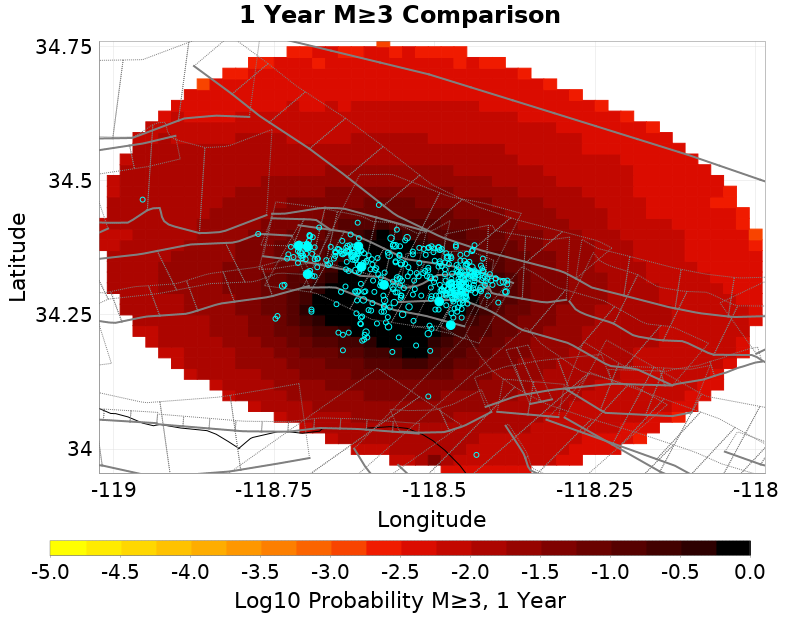 | 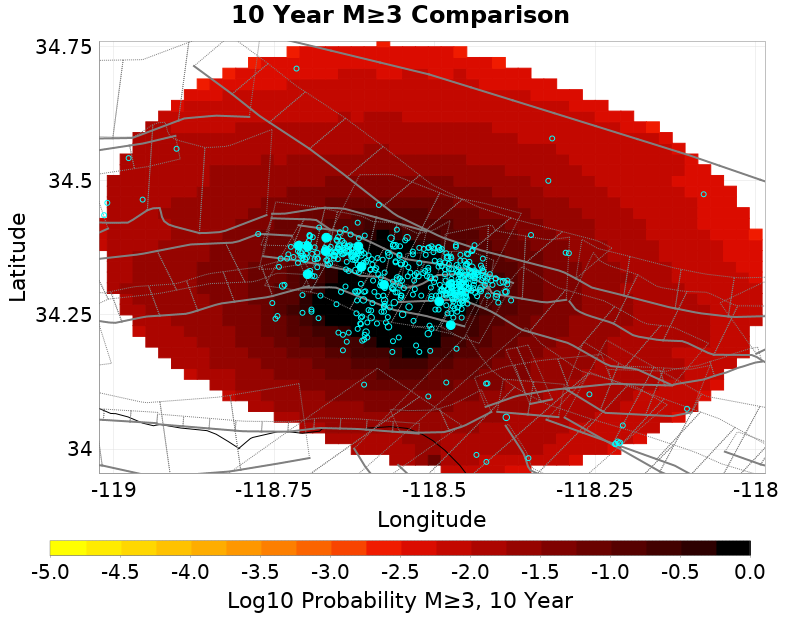 |
| Prob: 99.97%, Actual: 193 | Prob: 99.99%, Actual: 310 | Prob: 99.99%, Actual: 363 | Prob: 100.00%, Actual: 419 | Prob: 100.00%, Actual: 513 | |
| M≥4 |  |  | 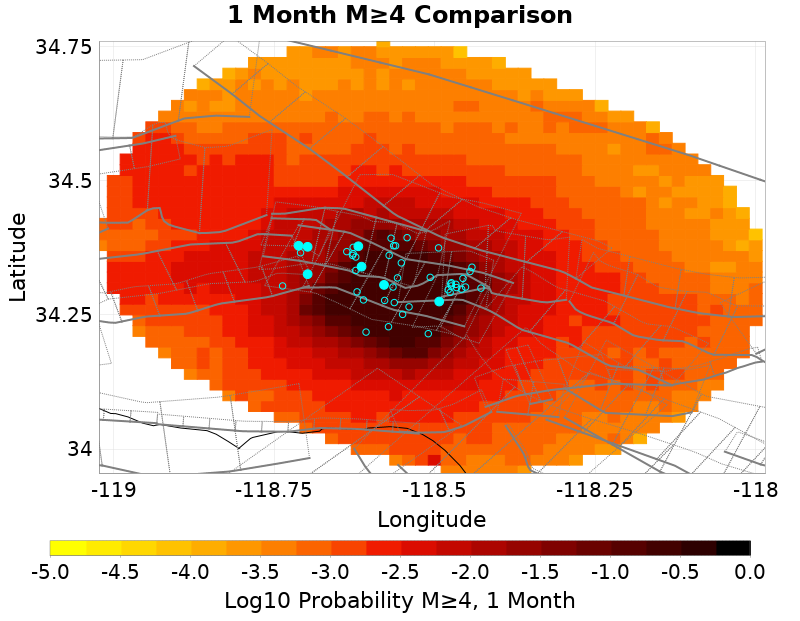 | 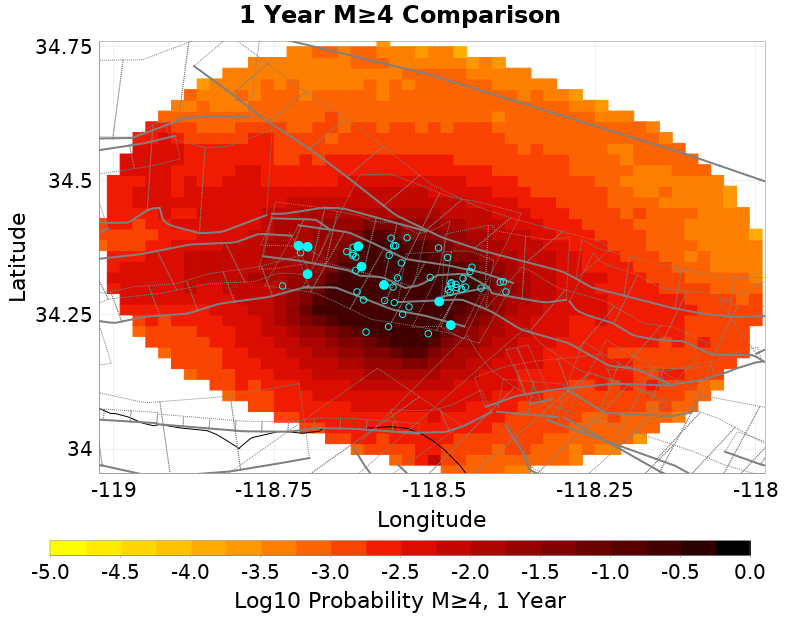 | 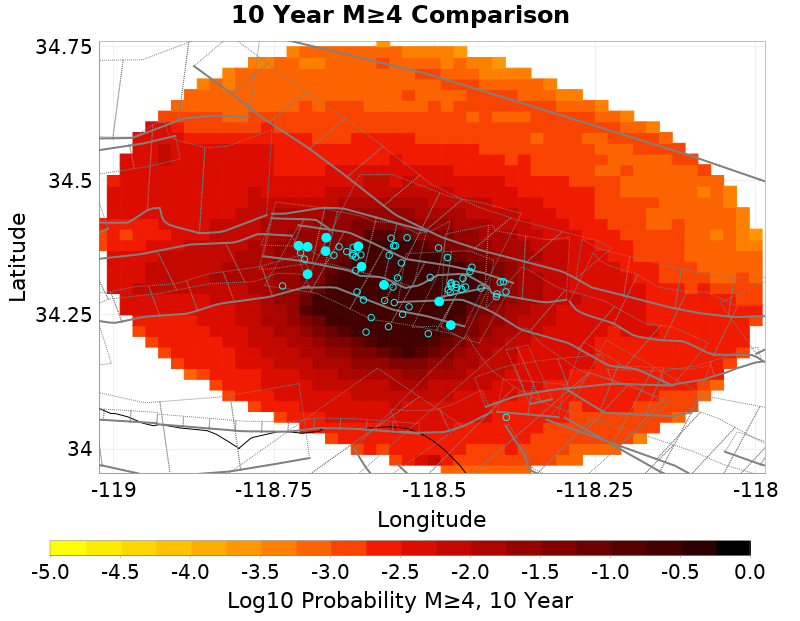 |
| Prob: 95.63%, Actual: 24 | Prob: 97.28%, Actual: 42 | Prob: 97.96%, Actual: 47 | Prob: 98.65%, Actual: 52 | Prob: 98.95%, Actual: 62 | |
| M≥5 | 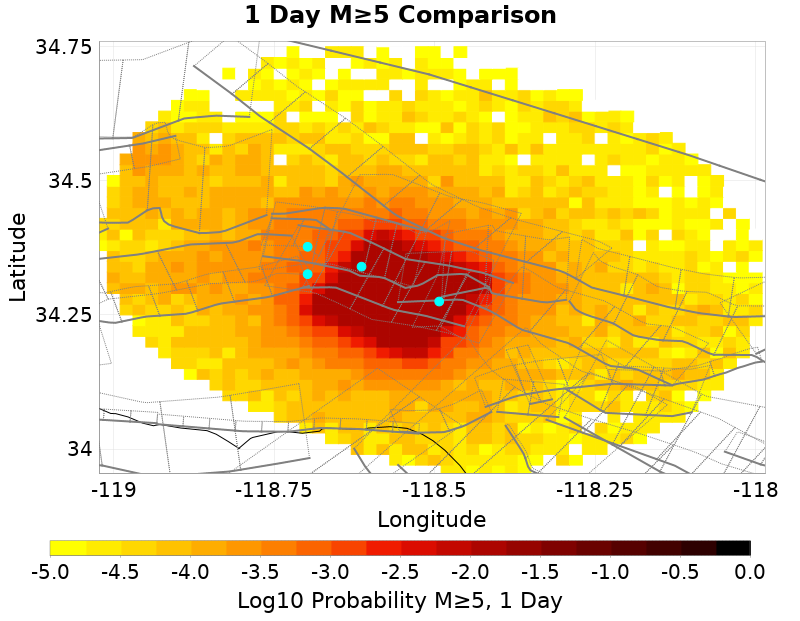 | 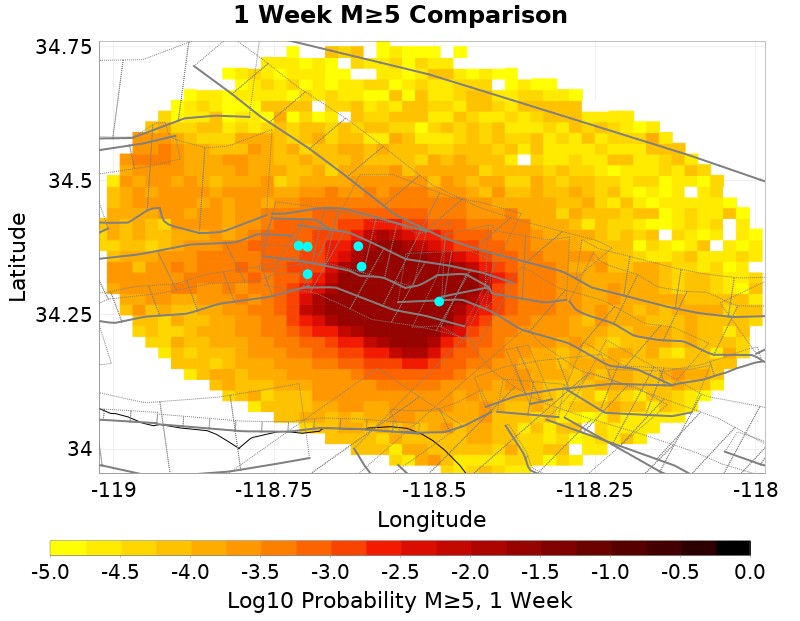 | 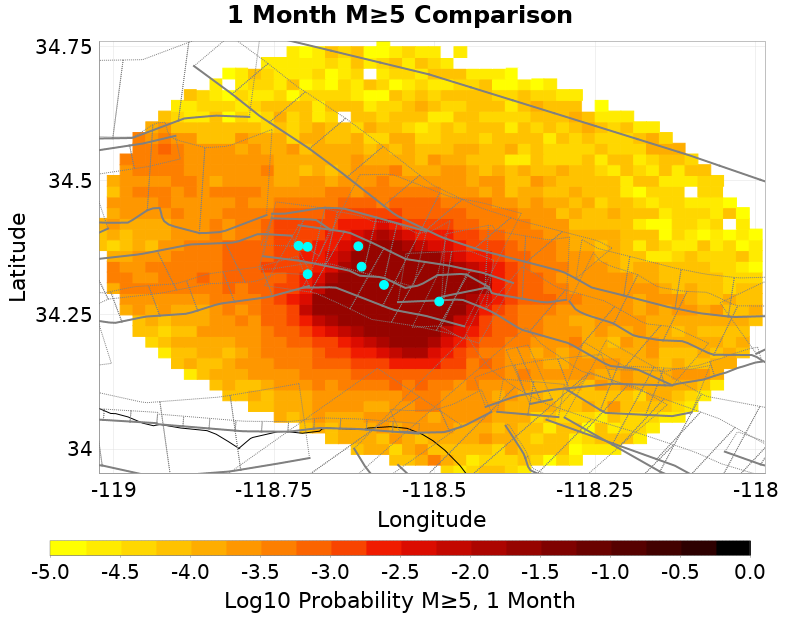 | 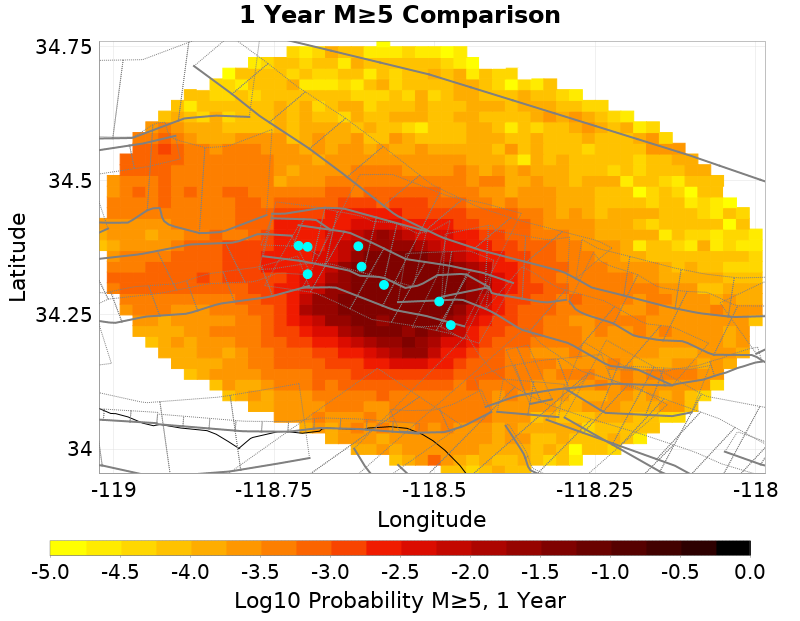 | 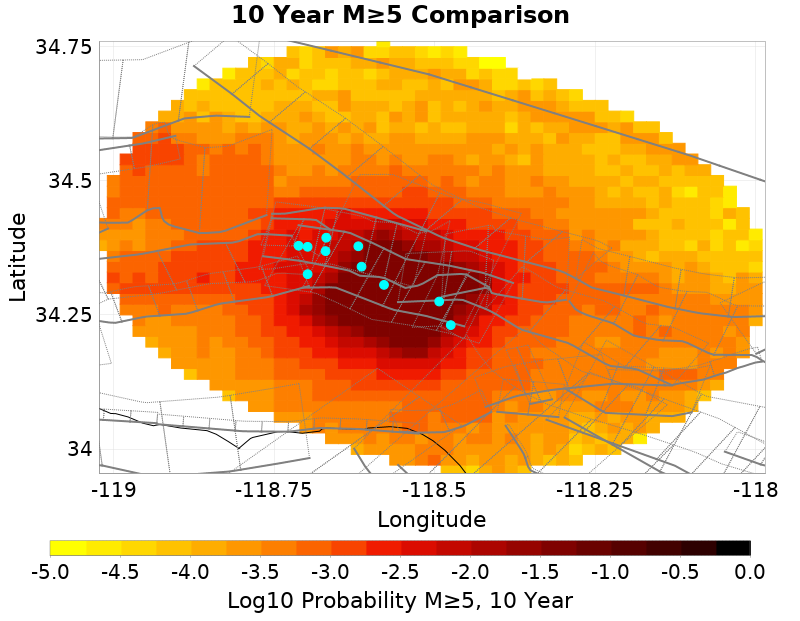 |
| Prob: 56.10%, Actual: 4 | Prob: 64.06%, Actual: 6 | Prob: 68.30%, Actual: 7 | Prob: 73.88%, Actual: 8 | Prob: 77.42%, Actual: 10 | |
| M≥6 | 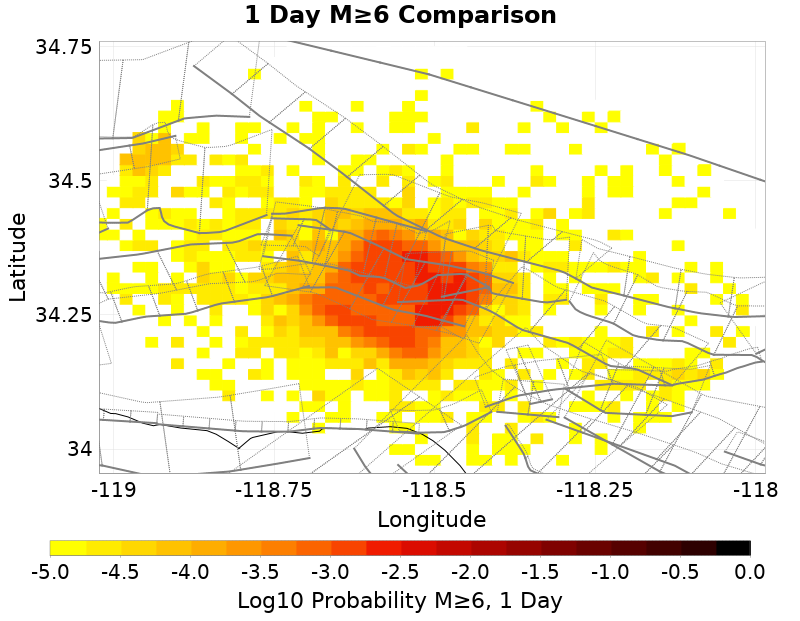 | 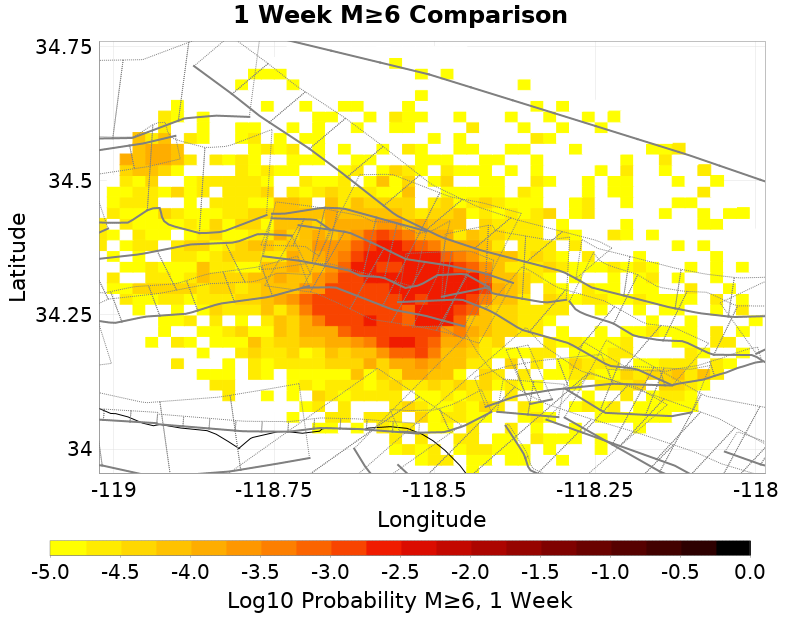 | 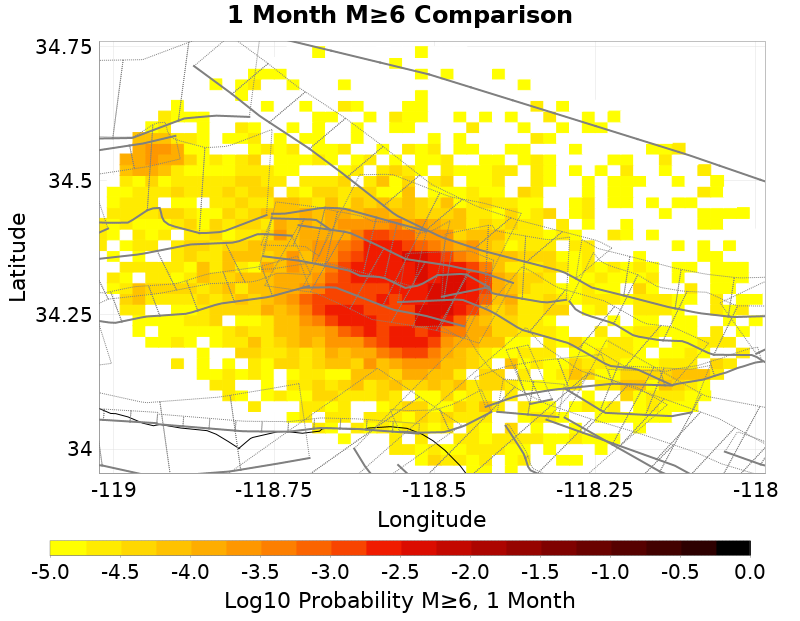 | 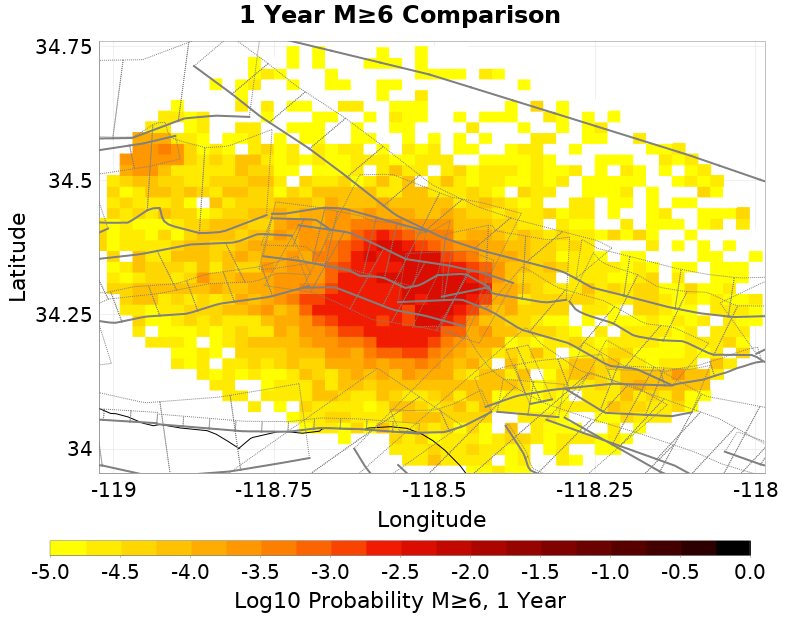 | 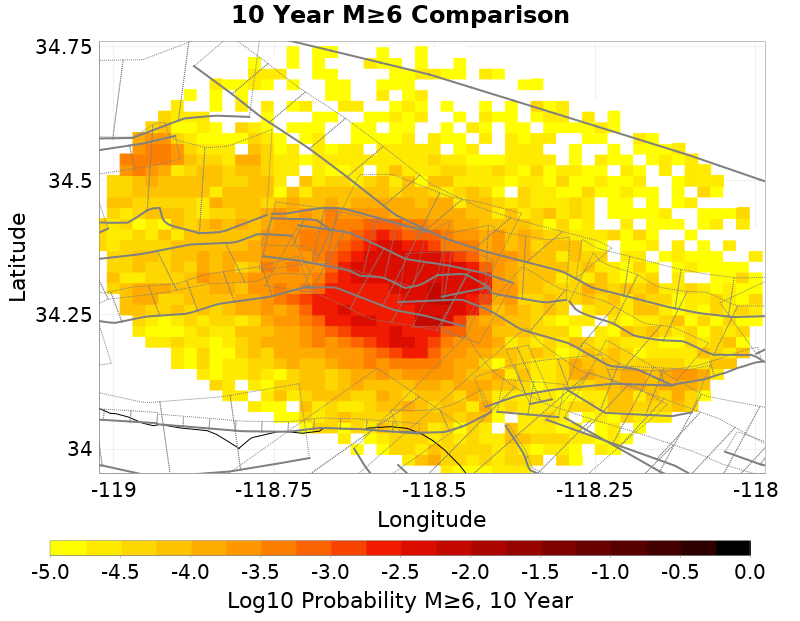 |
| Prob: 11.53%, Actual: 0 | Prob: 15.29%, Actual: 0 | Prob: 17.97%, Actual: 0 | Prob: 22.12%, Actual: 0 | Prob: 25.45%, Actual: 0 | |
| M≥7 | 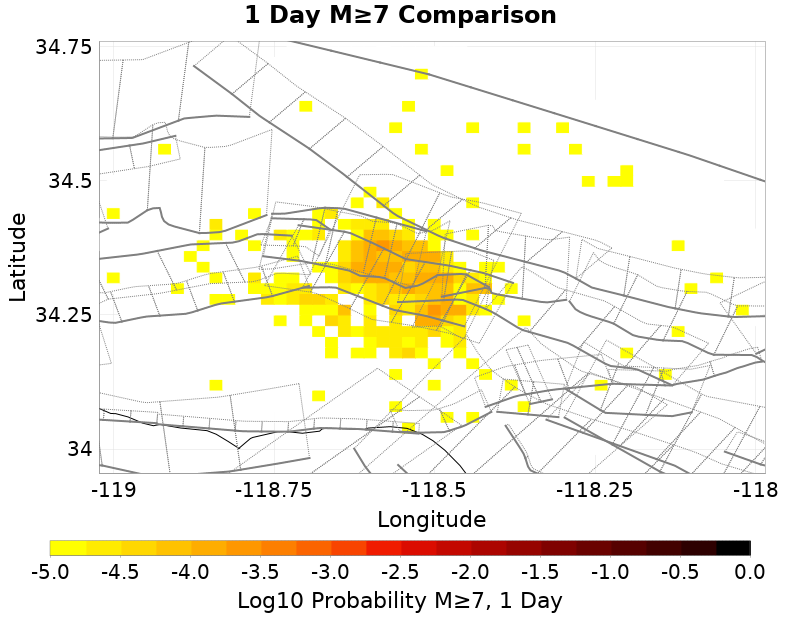 | 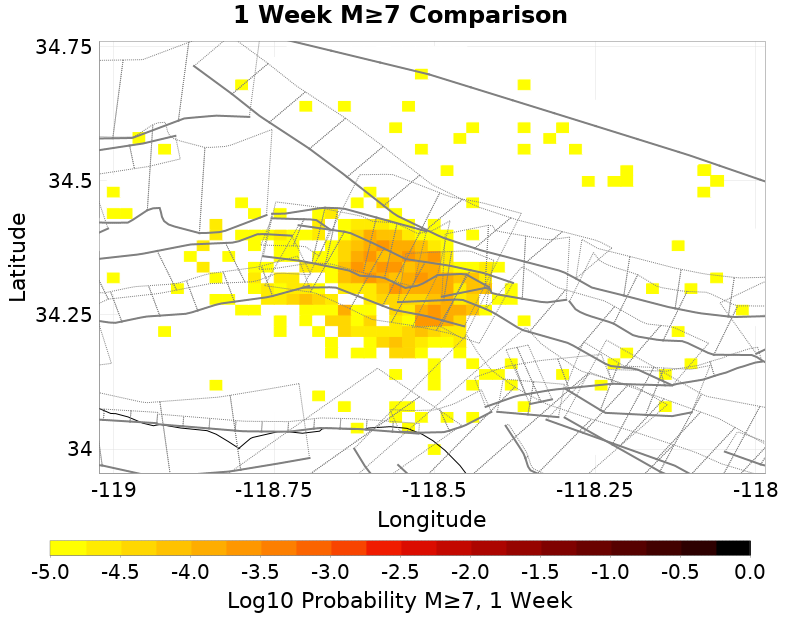 | 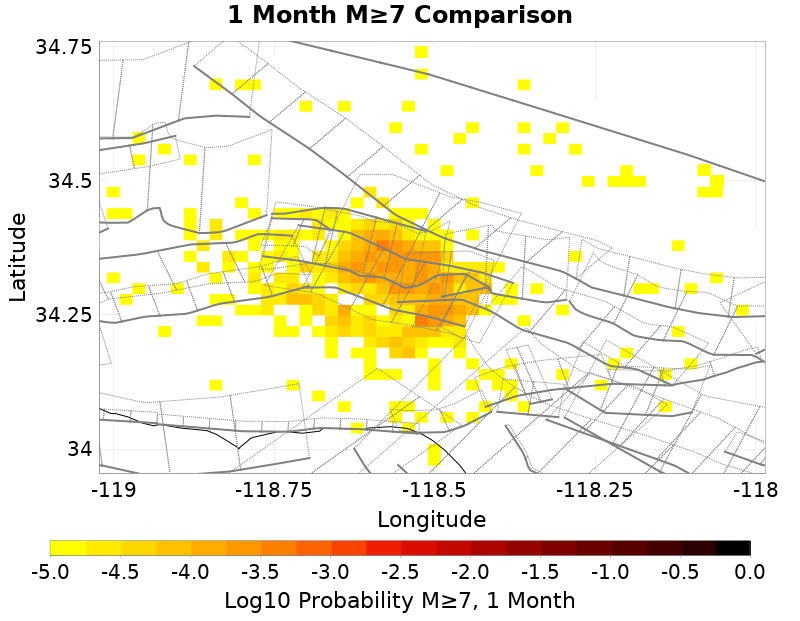 | 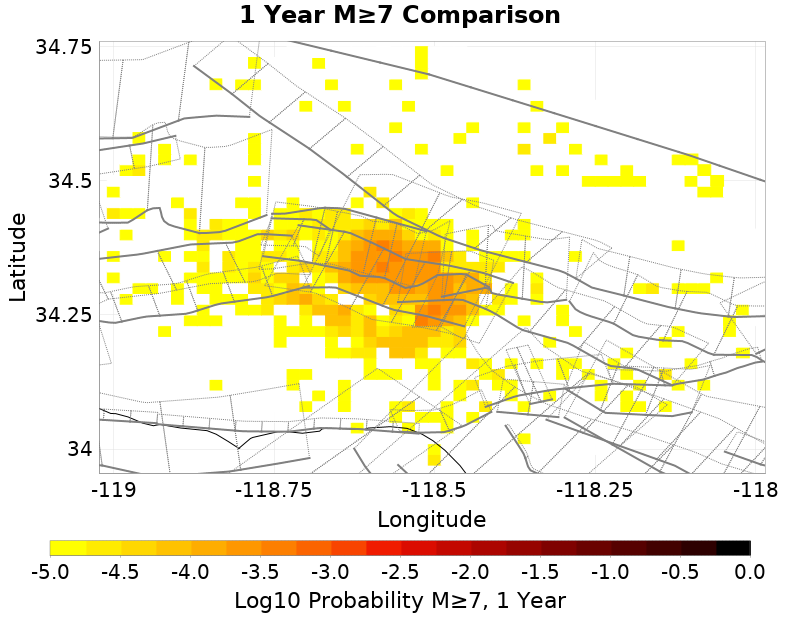 | 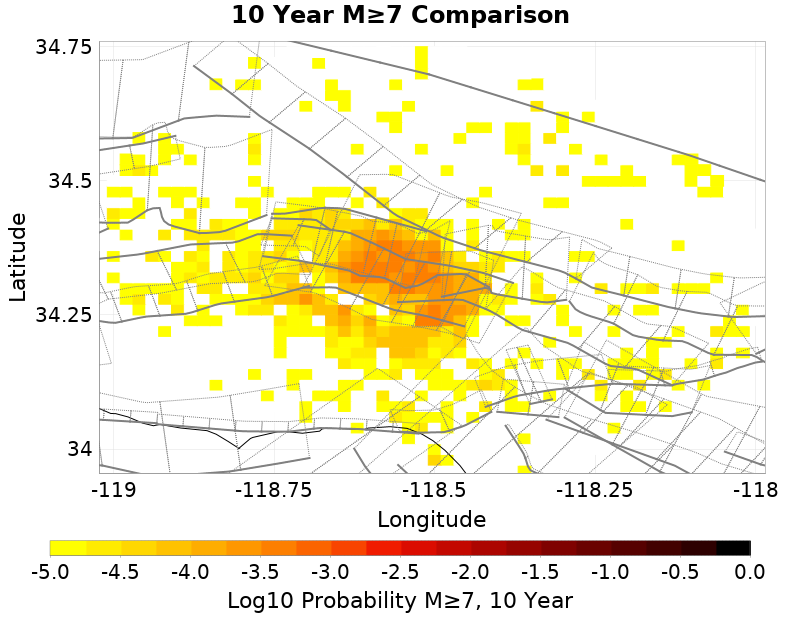 |
| Prob: 0.76%, Actual: 0 | Prob: 1.08%, Actual: 0 | Prob: 1.36%, Actual: 0 | Prob: 1.88%, Actual: 0 | Prob: 2.36%, Actual: 0 | |
| M≥8 | 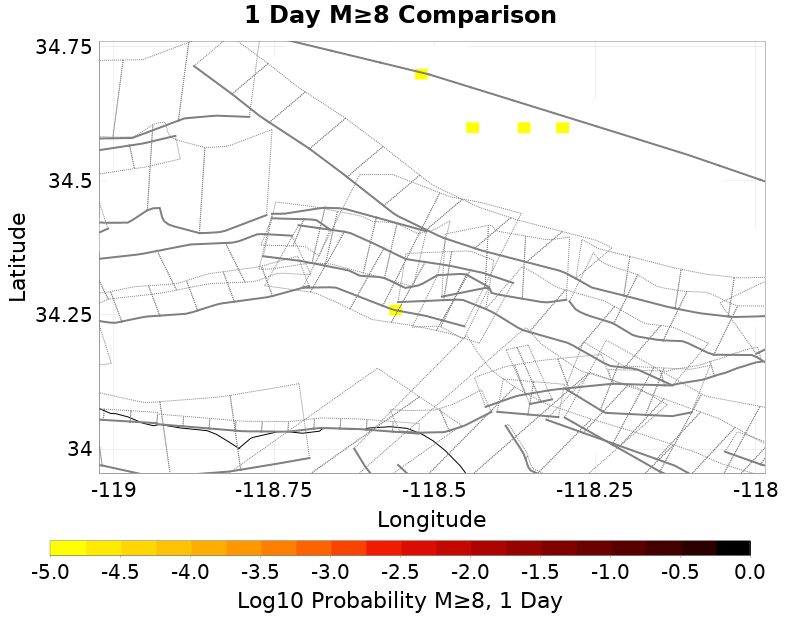 | 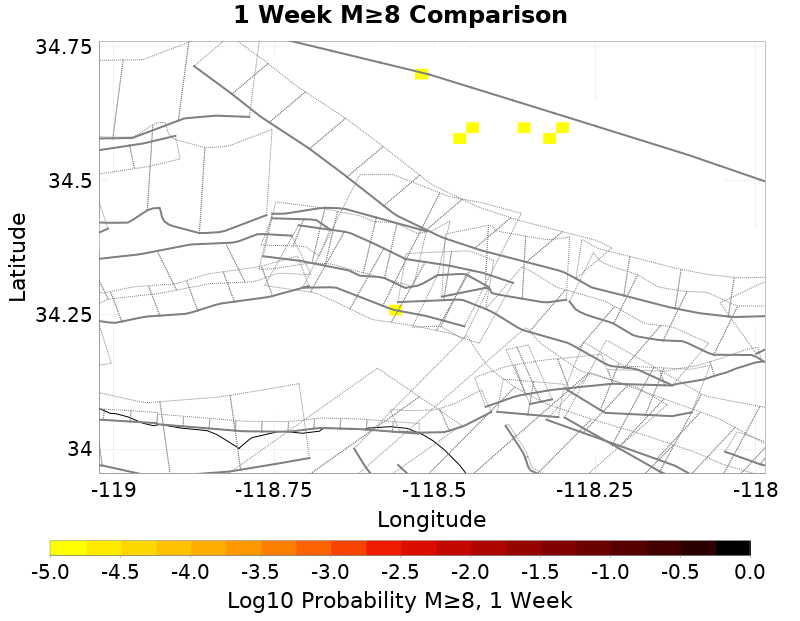 | 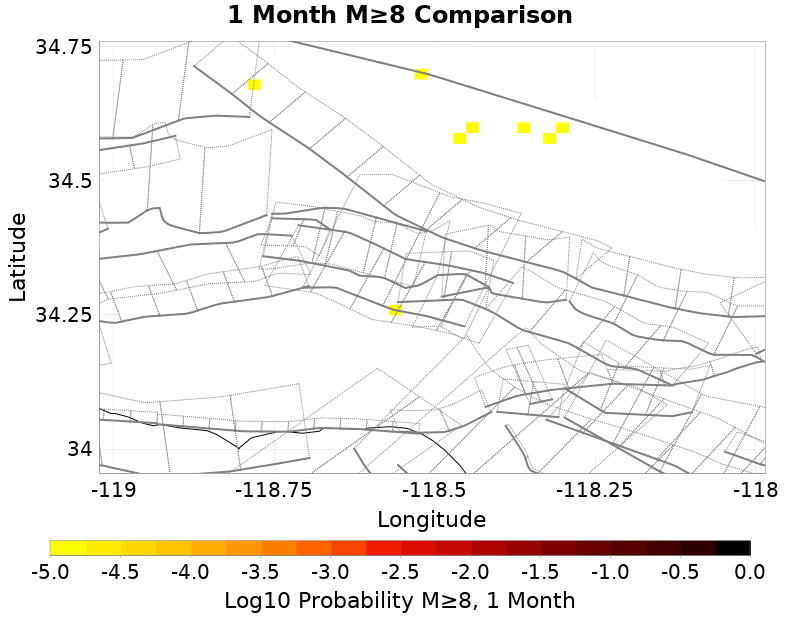 |  | 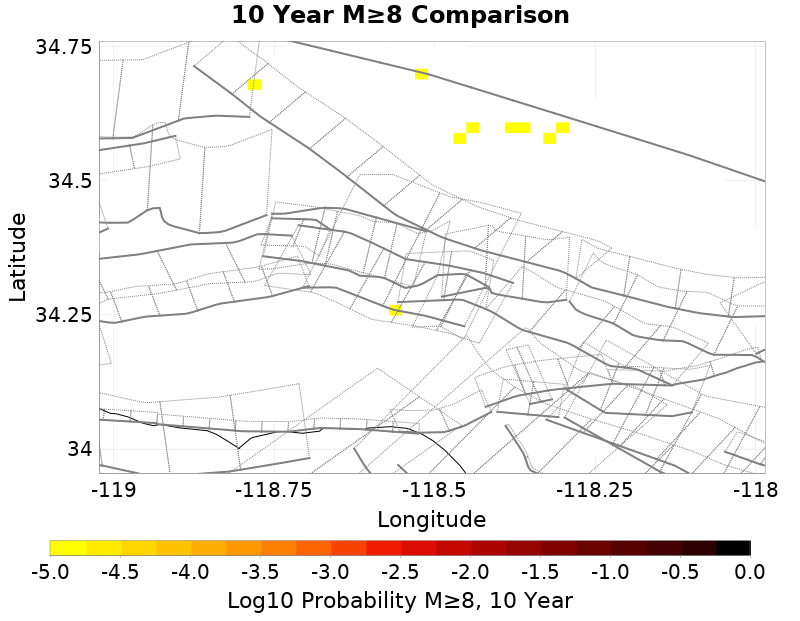 |
| Prob: 0.01%, Actual: 0 | Prob: 0.01%, Actual: 0 | Prob: 0.01%, Actual: 0 | Prob: 0.01%, Actual: 0 | Prob: 0.01%, Actual: 0 |
ComCat Mean Expectation Spatial Distribution
| 1 Day | 1 Week | 1 Month | 1 Year | 10 Year | |
|---|---|---|---|---|---|
| M≥Mc(t) | 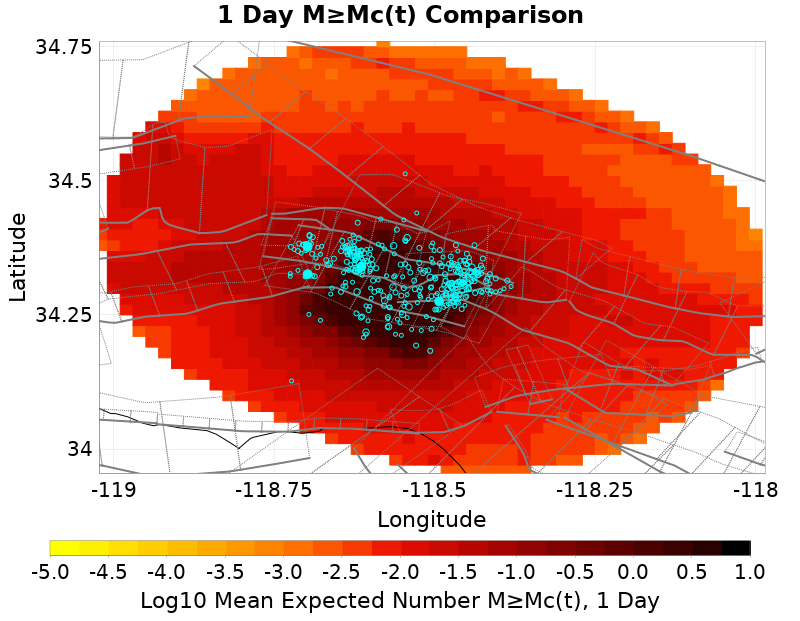 |  |  | 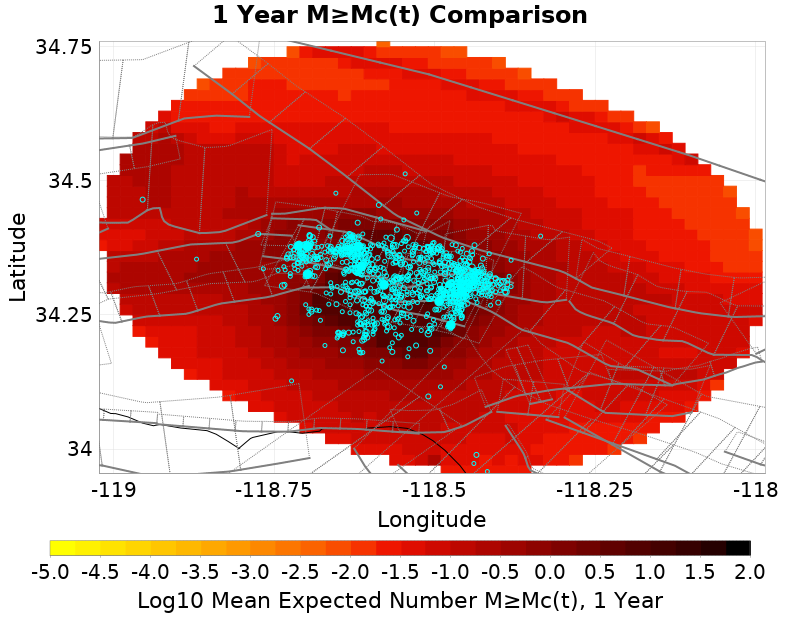 | 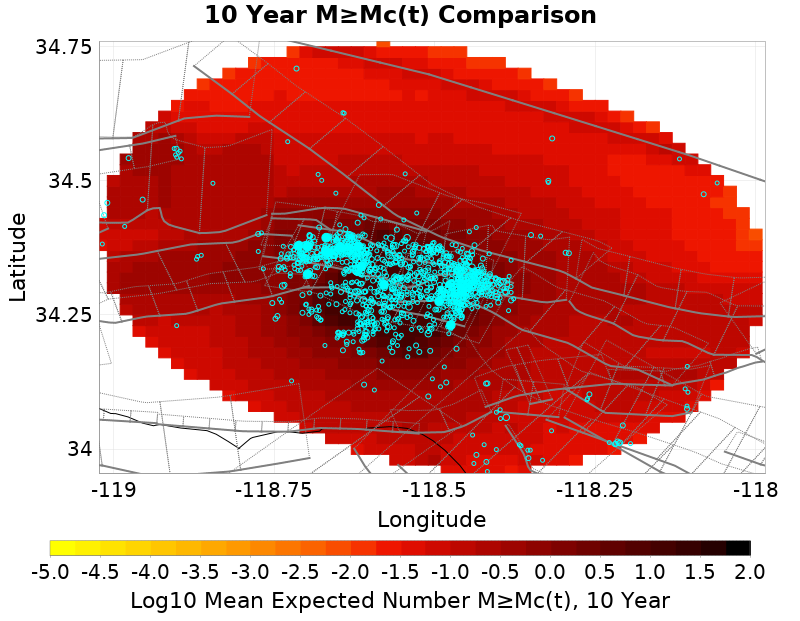 |
| Mean: 242.871, Actual: 344 | Mean: 497.651, Actual: 690 | Mean: 707.573, Actual: 863 | Mean: 1107.219, Actual: 1043 | Mean: 1514.242, Actual: 1306 | |
| M≥3 |  | 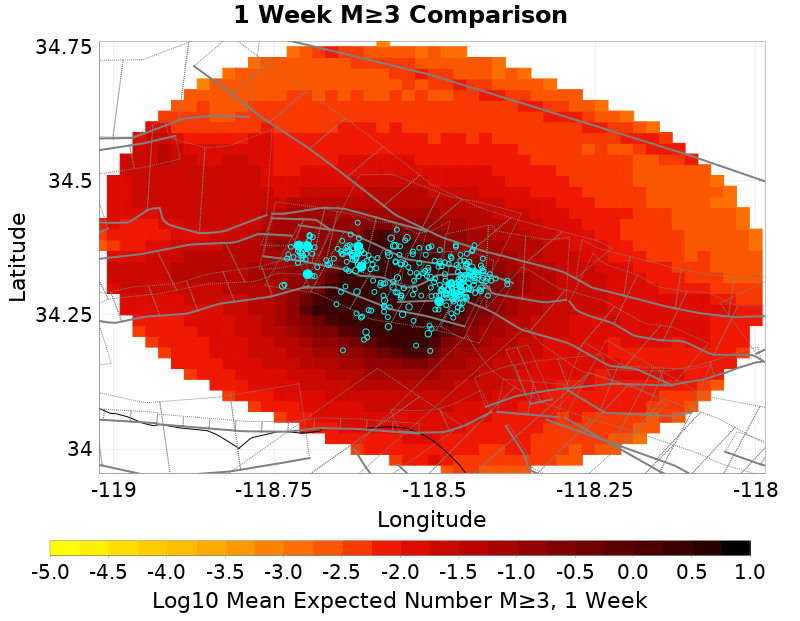 | 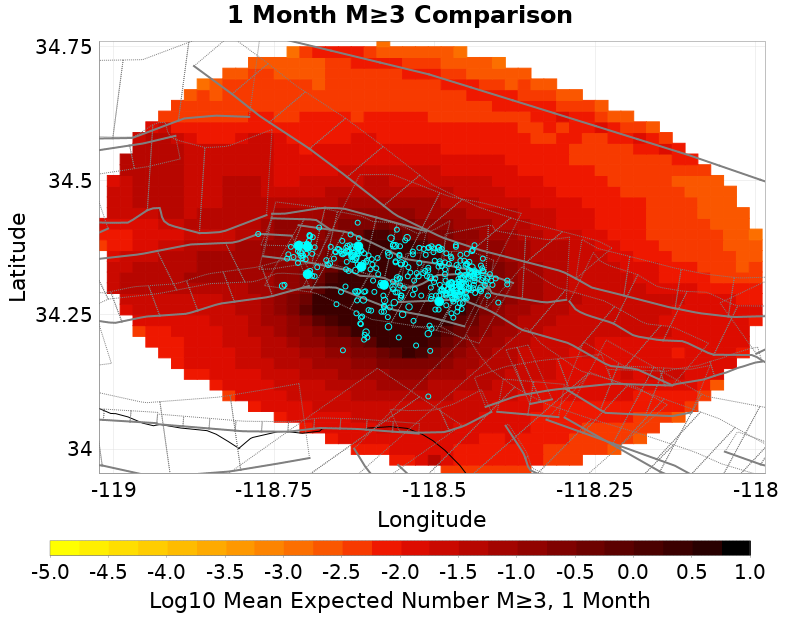 |  |  |
| Mean: 171.559, Actual: 193 | Mean: 252.158, Actual: 310 | Mean: 318.491, Actual: 363 | Mean: 444.843, Actual: 419 | Mean: 573.514, Actual: 513 | |
| M≥4 | 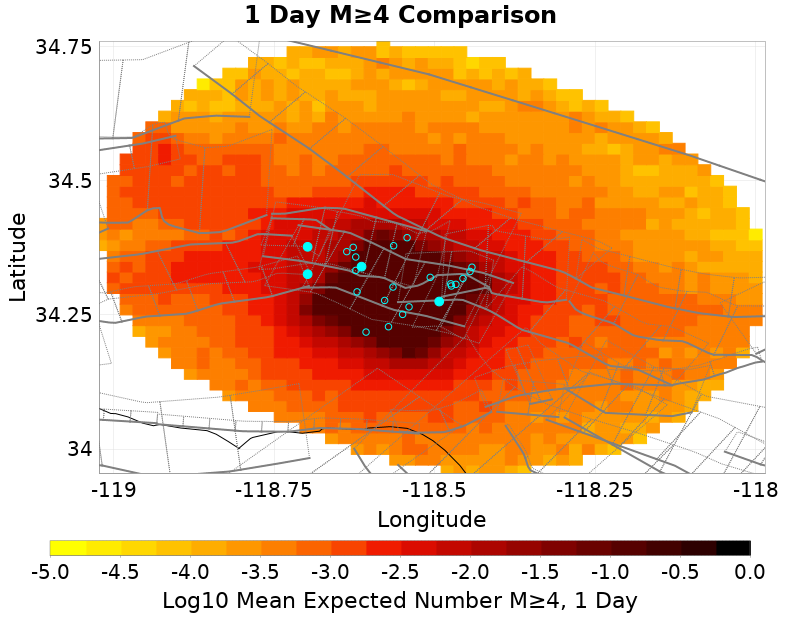 | 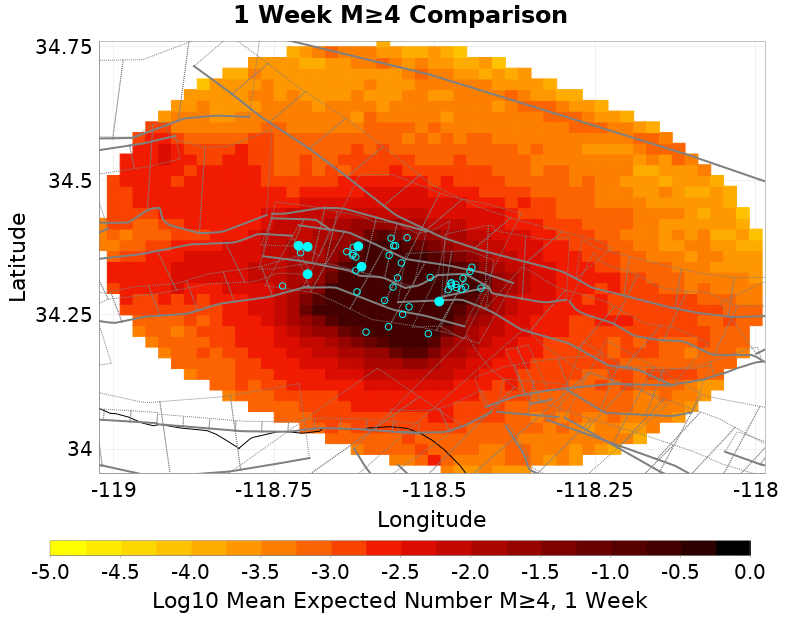 | 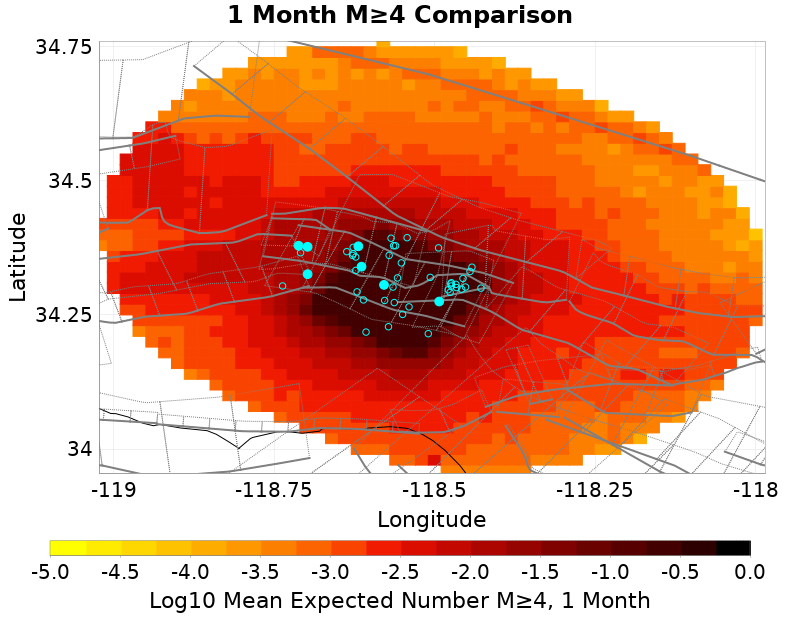 |  | 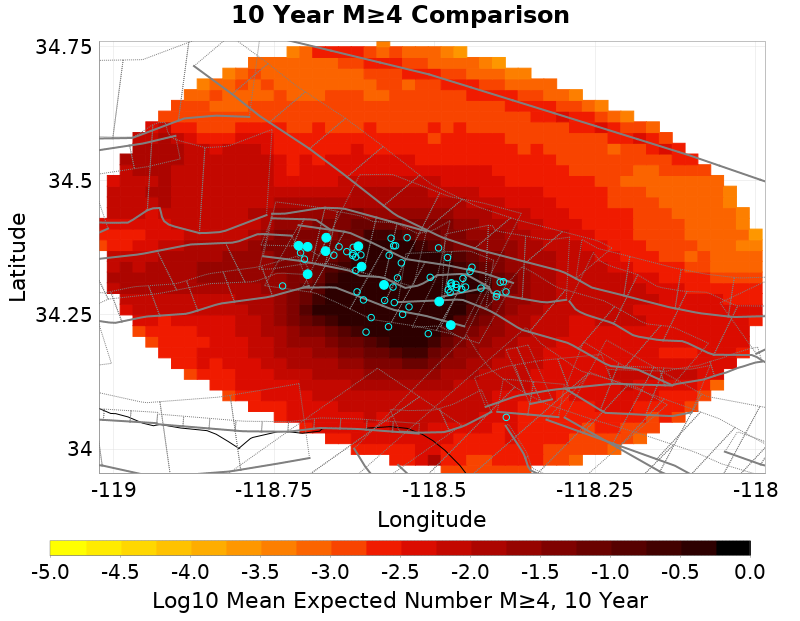 |
| Mean: 17.147, Actual: 24 | Mean: 25.202, Actual: 42 | Mean: 31.839, Actual: 47 | Mean: 44.460, Actual: 52 | Mean: 57.302, Actual: 62 | |
| M≥5 | 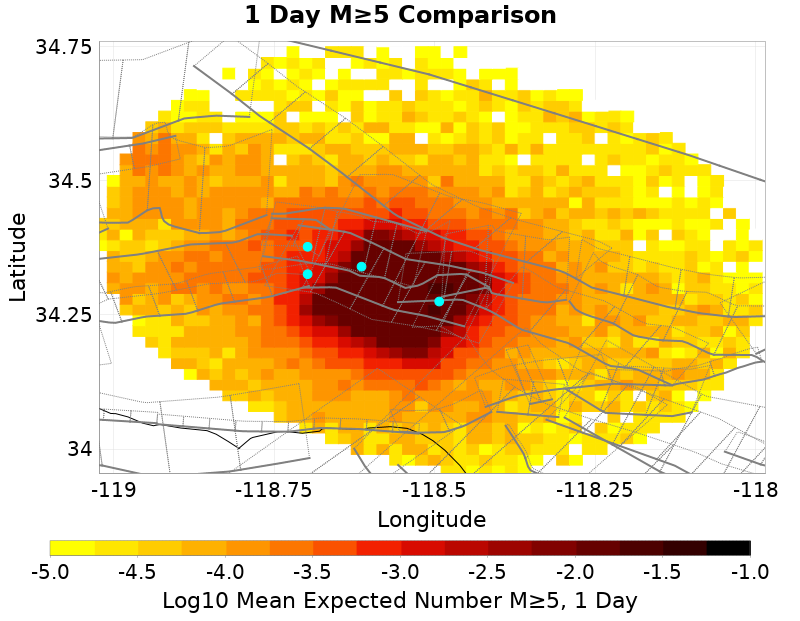 | 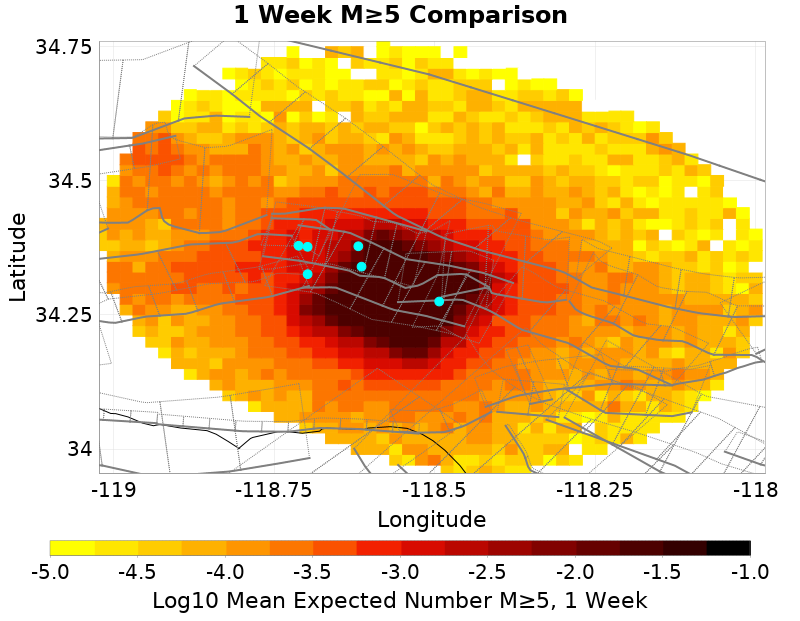 | 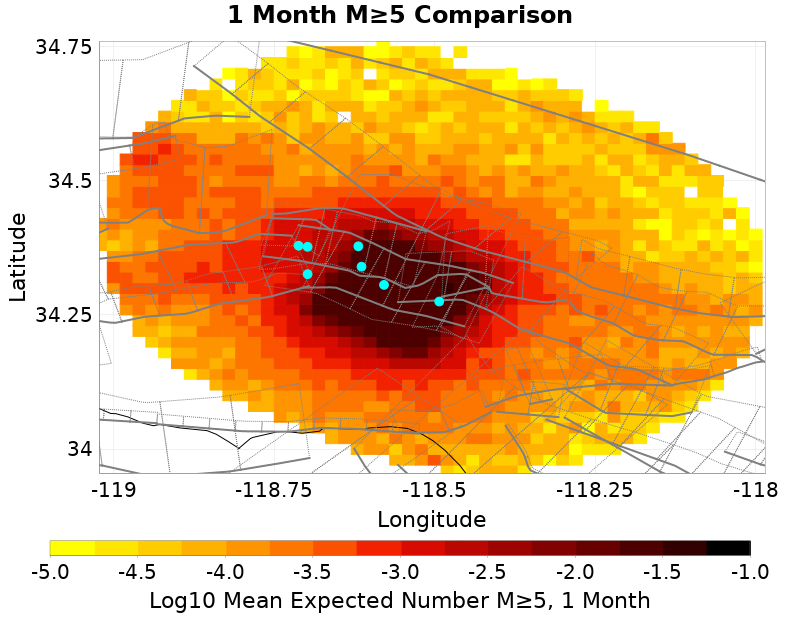 | 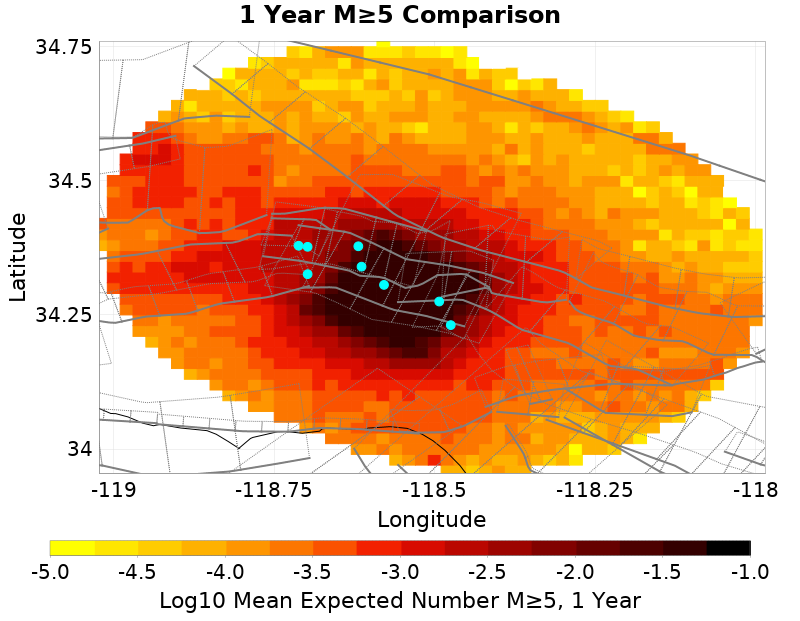 | 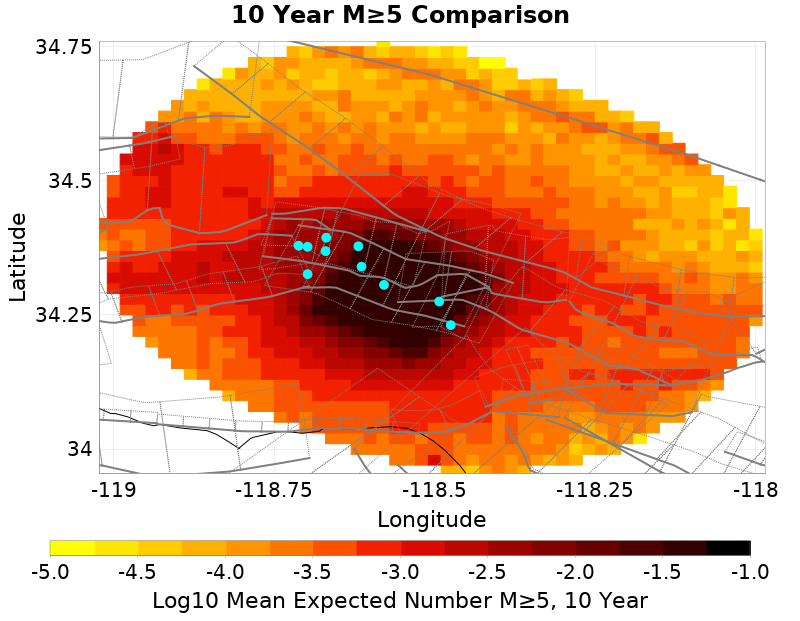 |
| Mean: 1.692, Actual: 4 | Mean: 2.486, Actual: 6 | Mean: 3.139, Actual: 7 | Mean: 4.378, Actual: 8 | Mean: 5.637, Actual: 10 | |
| M≥6 | 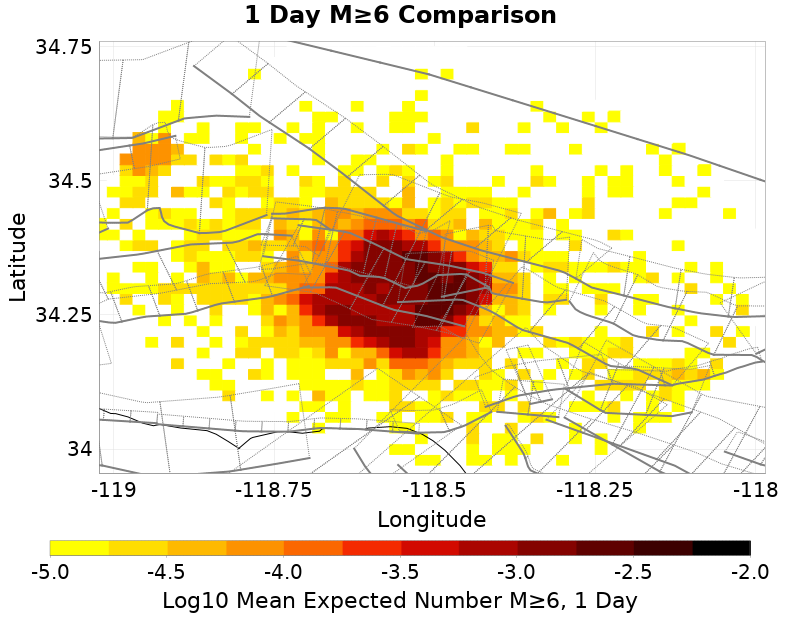 | 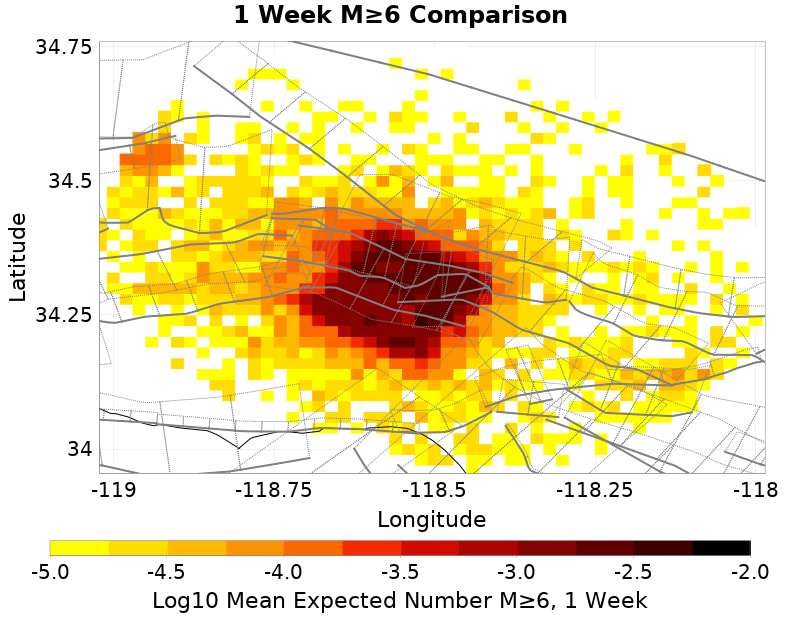 | 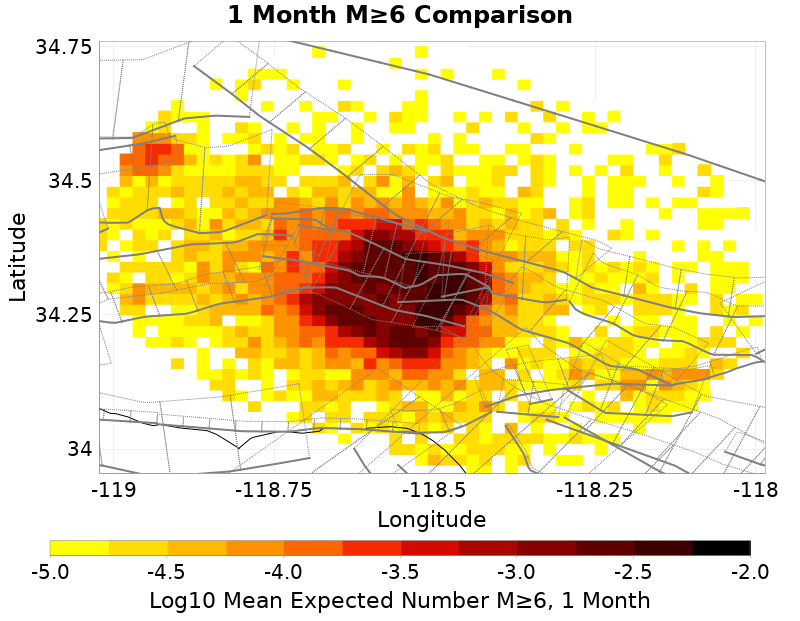 |  | 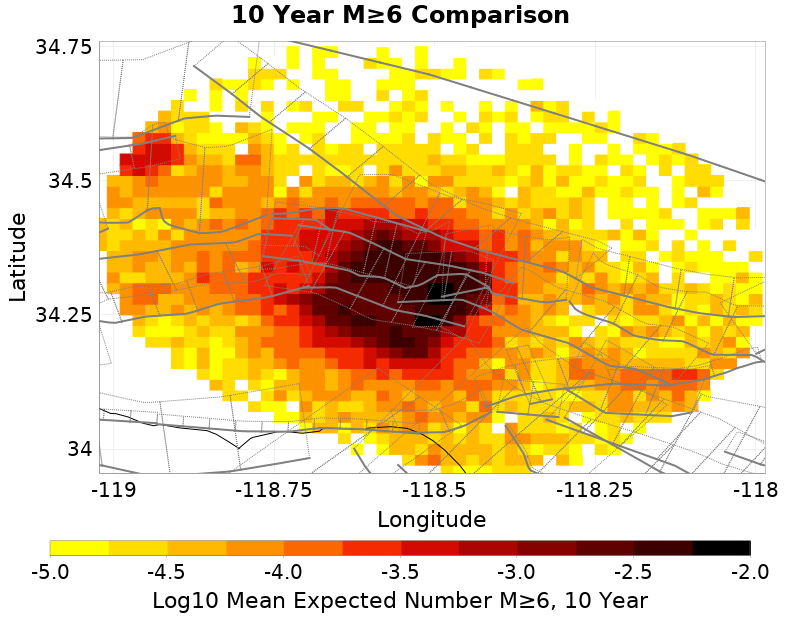 |
| Mean: 0.148, Actual: 0 | Mean: 0.215, Actual: 0 | Mean: 0.270, Actual: 0 | Mean: 0.373, Actual: 0 | Mean: 0.477, Actual: 0 | |
| M≥7 | 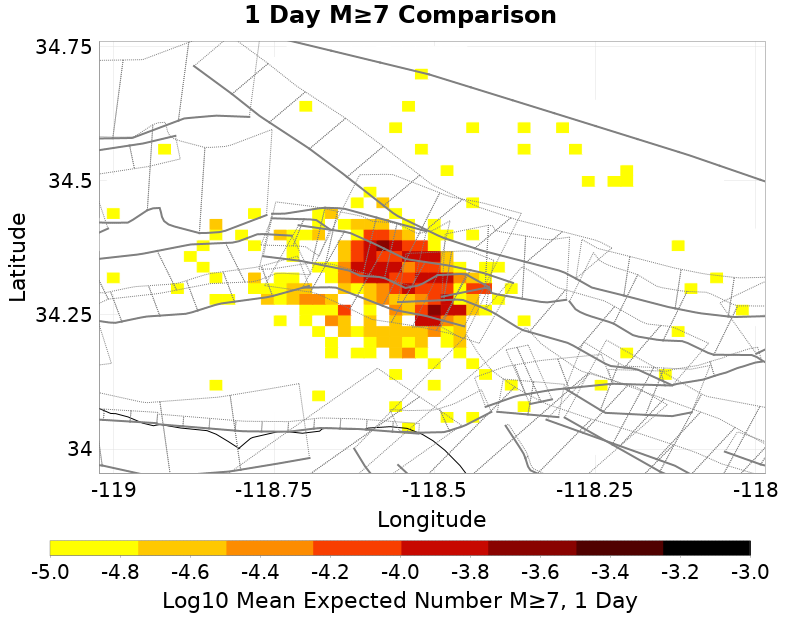 | 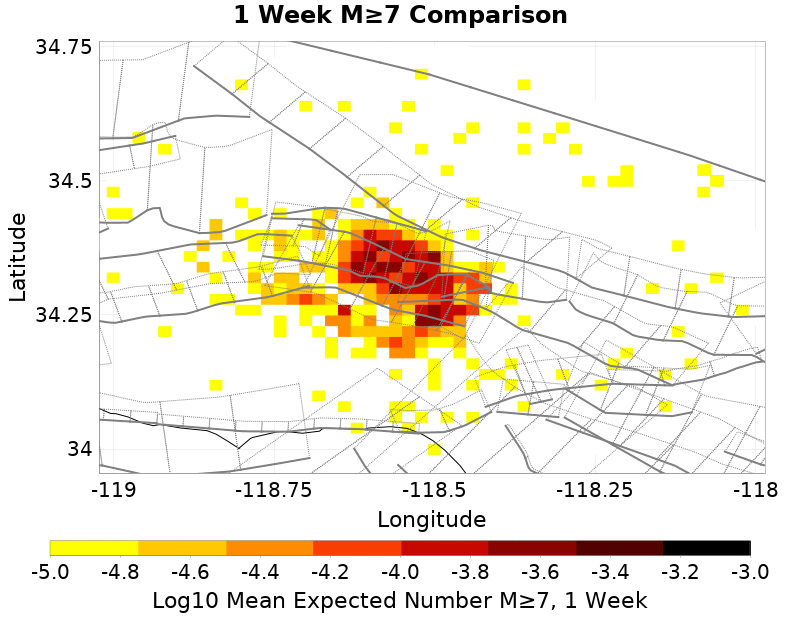 | 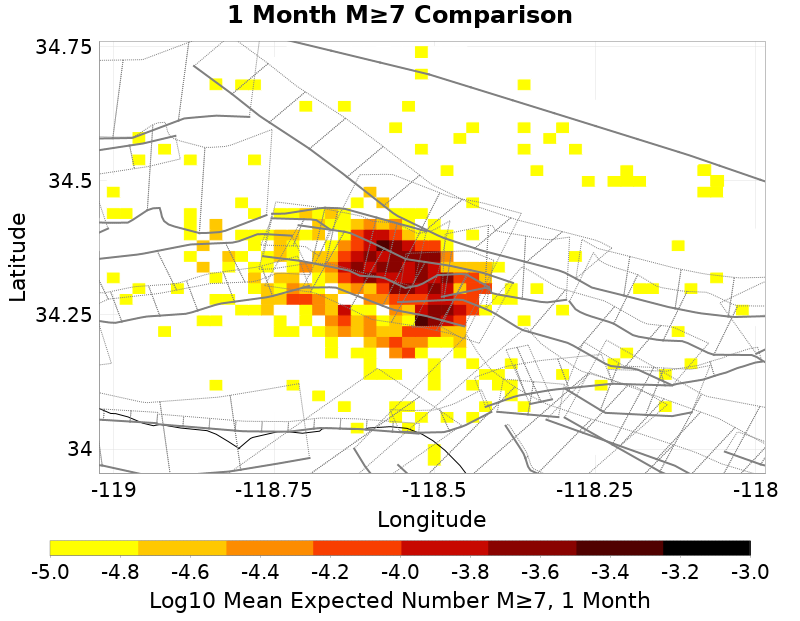 | 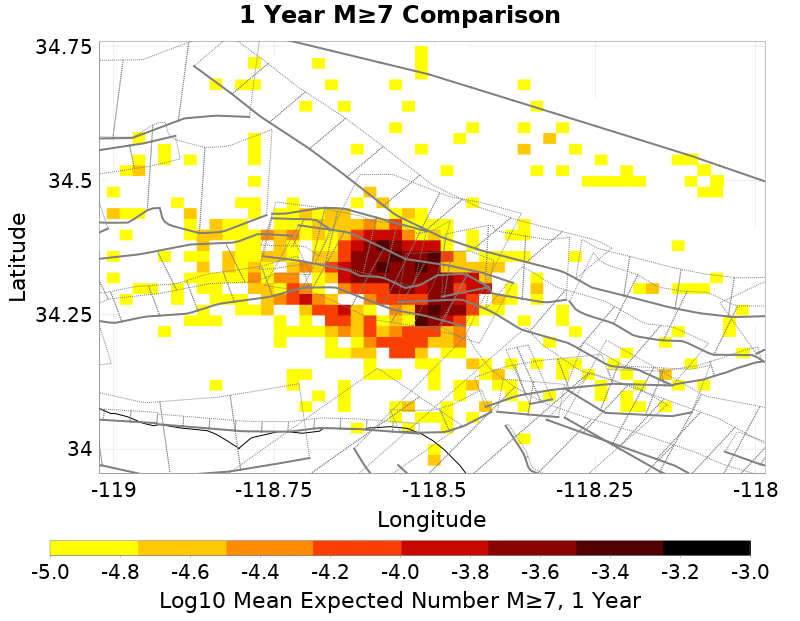 | 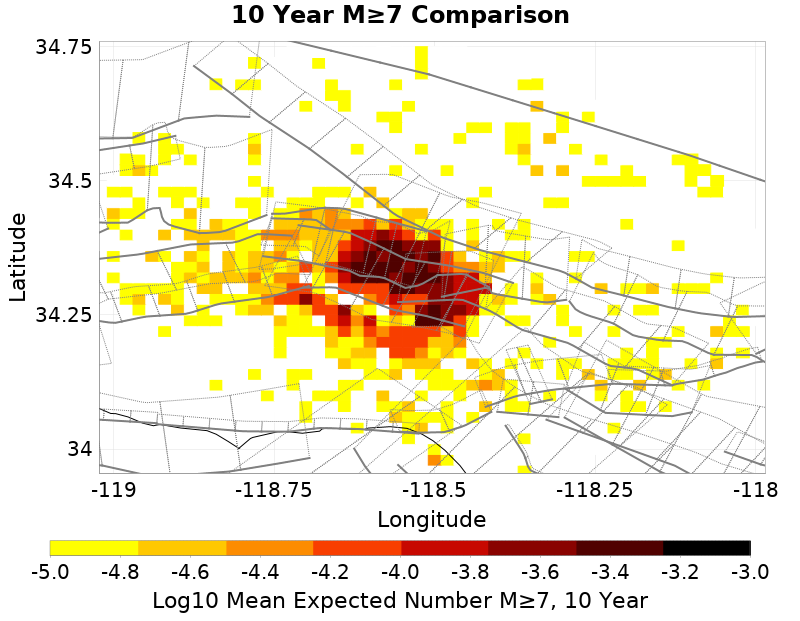 |
| Mean: 7.66E-3, Actual: 0 | Mean: 0.011, Actual: 0 | Mean: 0.014, Actual: 0 | Mean: 0.020, Actual: 0 | Mean: 0.026, Actual: 0 | |
| M≥8 | 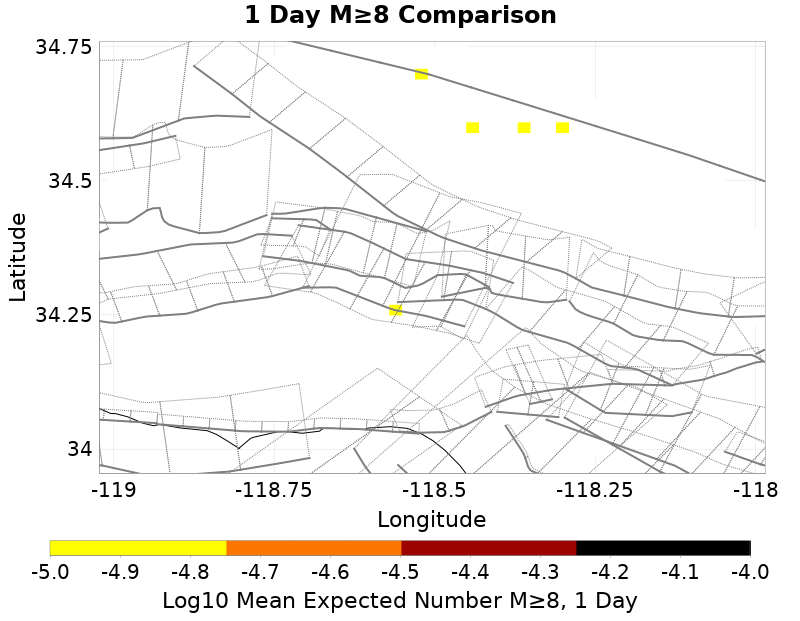 |  |  | 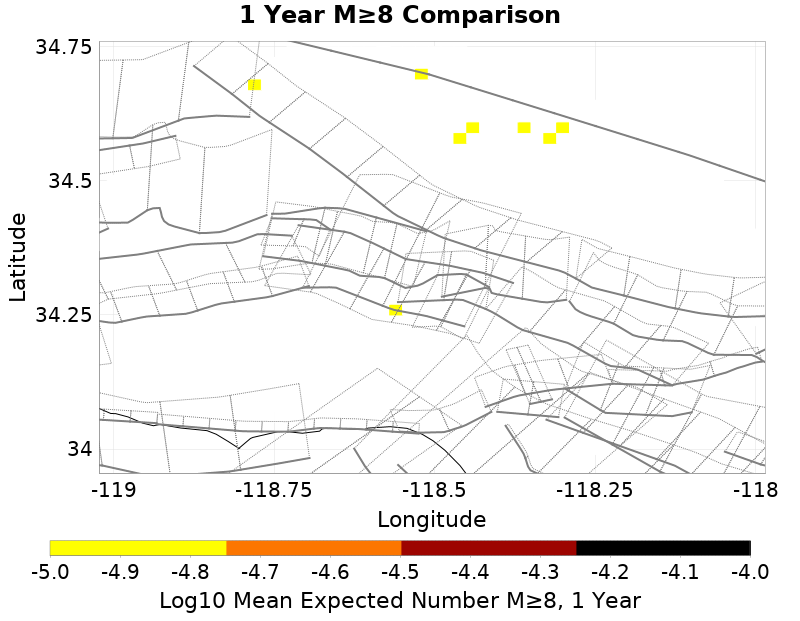 |  |
| Mean: 5.00E-5, Actual: 0 | Mean: 7.00E-5, Actual: 0 | Mean: 8.00E-5, Actual: 0 | Mean: 8.00E-5, Actual: 0 | Mean: 9.00E-5, Actual: 0 |
ComCat Depth Distribution
| M≥Mc(t) | M≥3 | M≥4 | M≥5 | M≥6 | M≥7 | M≥8 |
|---|---|---|---|---|---|---|
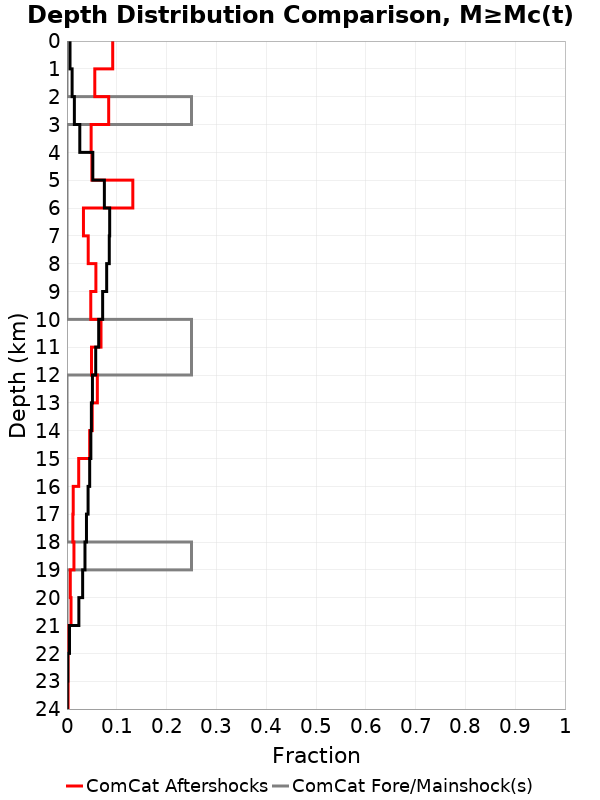 | 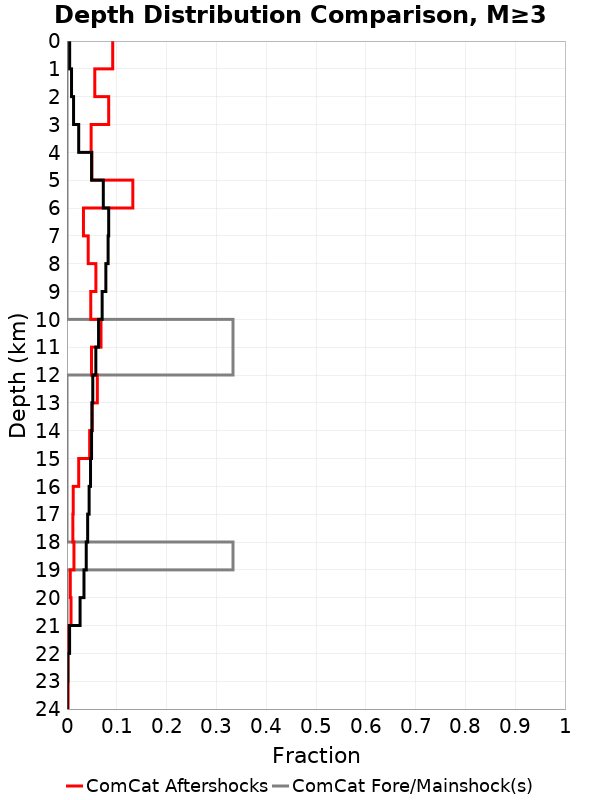 | 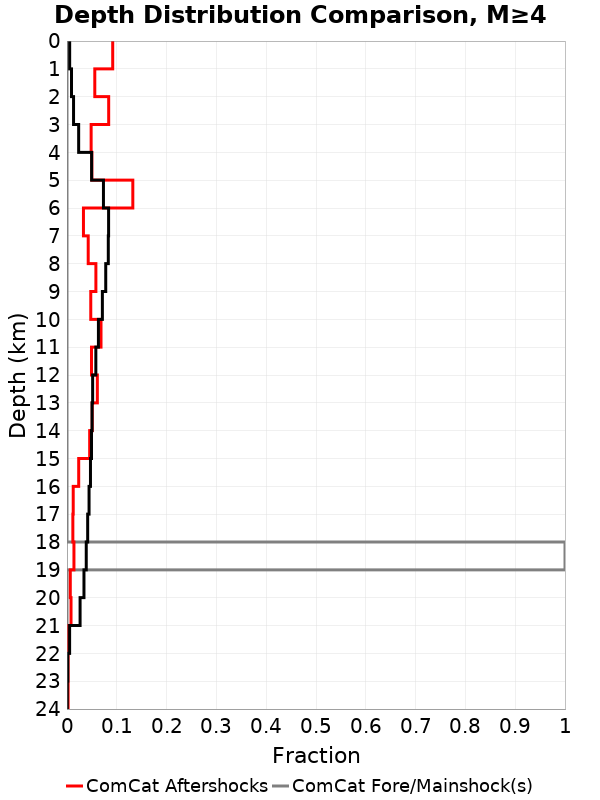 |  | 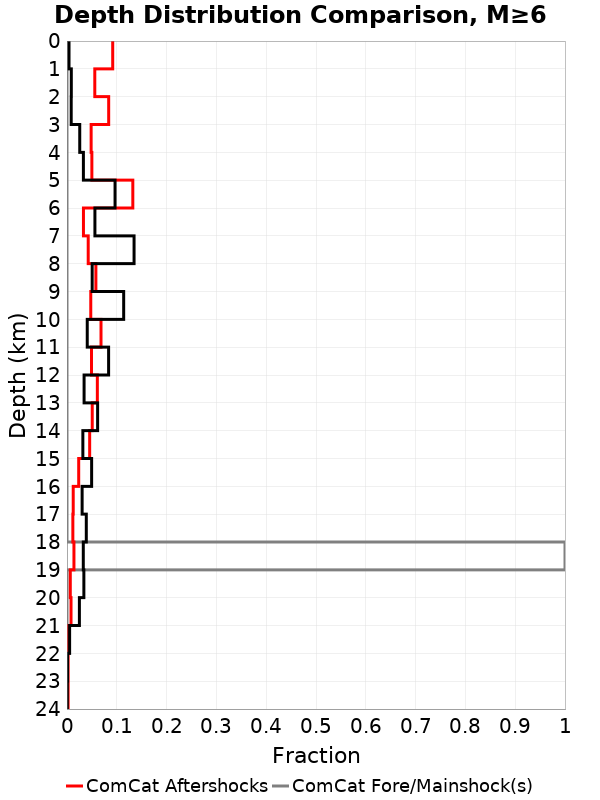 | 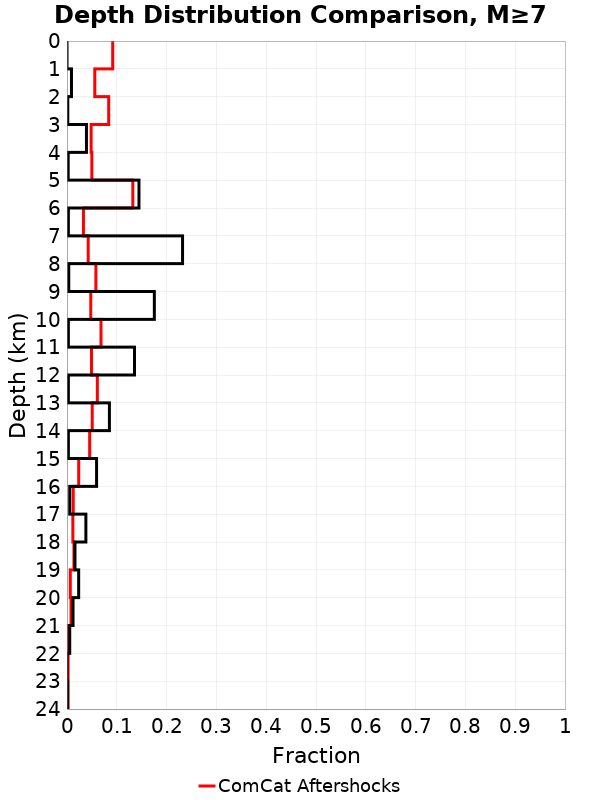 | 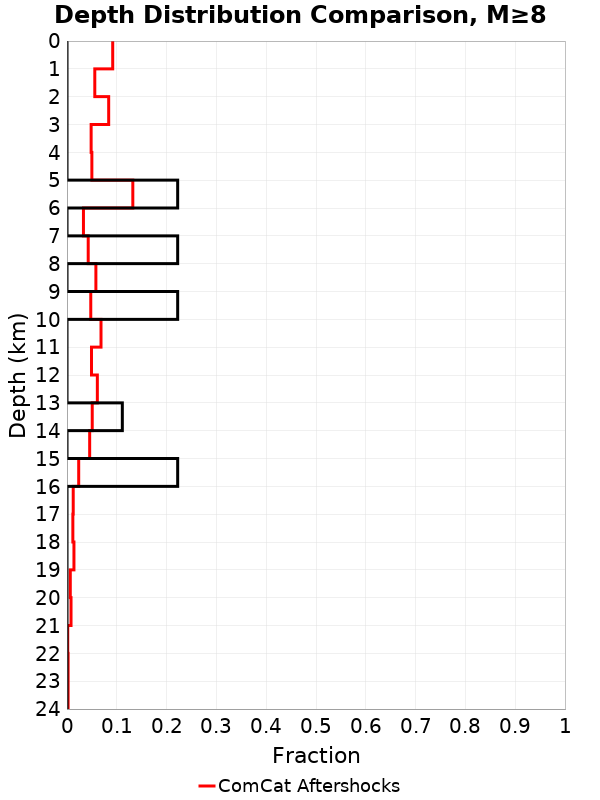 |
Section Participation
Section Participation Plots
| Min Mag | 1 yr Triggered Ruptures (no spontaneous) | 10 yr Triggered Ruptures (no spontaneous) | 10 yr Triggered Ruptures (primary aftershocks only) |
|---|---|---|---|
| All Supra. Seis. | 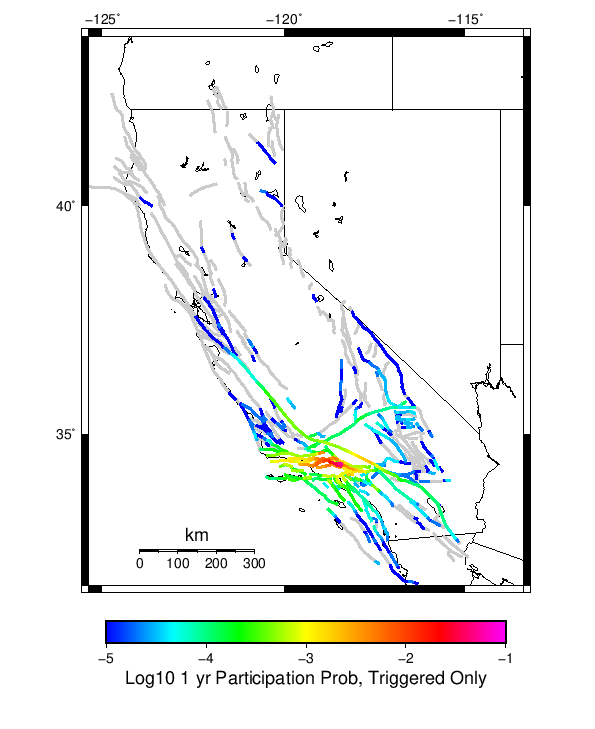 | 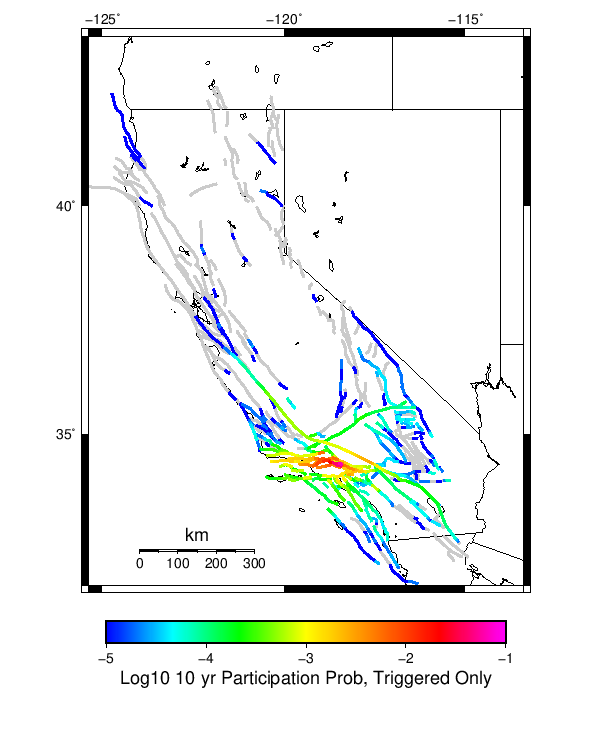 | 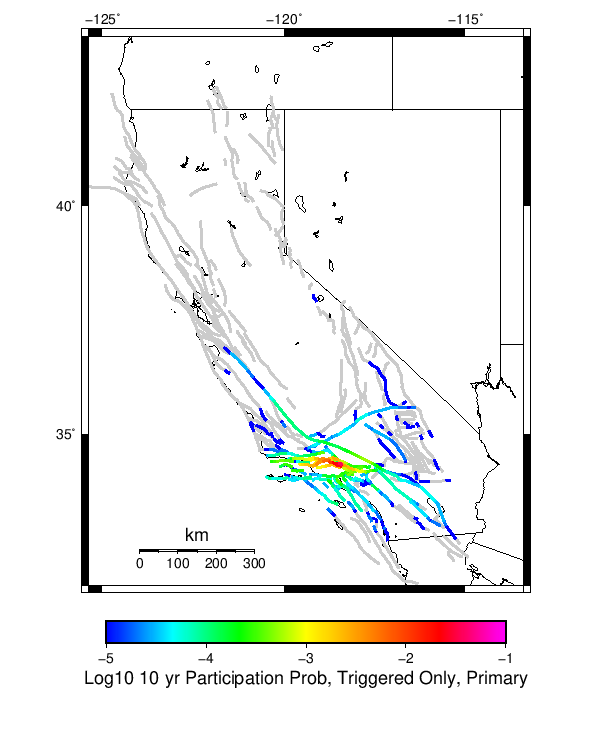 |
| M≥6.5 |  | 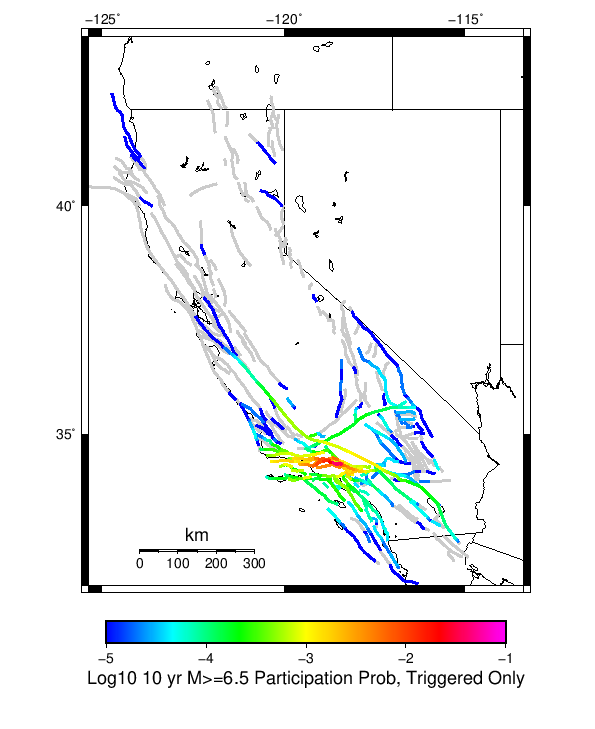 |  |
| M≥7 | 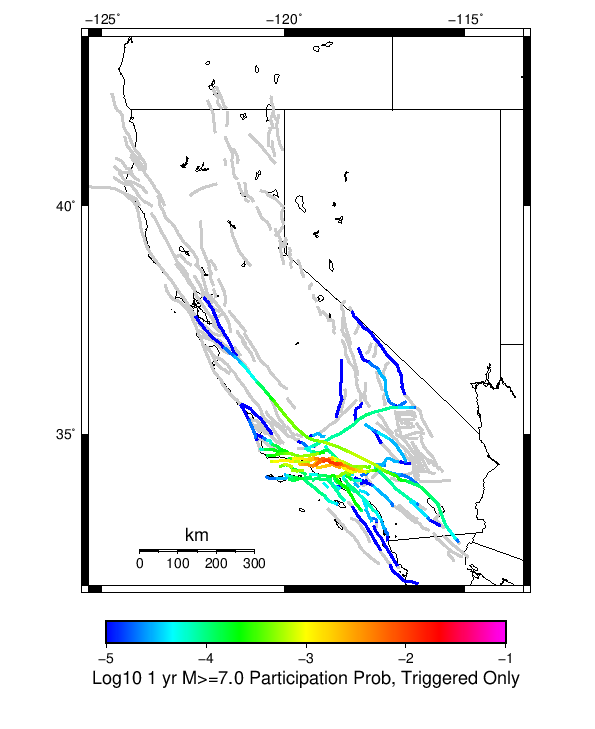 | 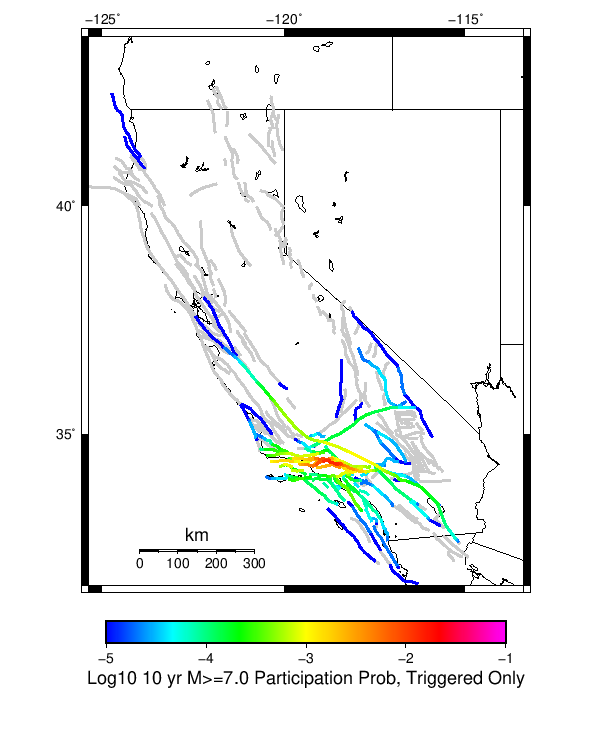 |  |
| M≥7.5 | 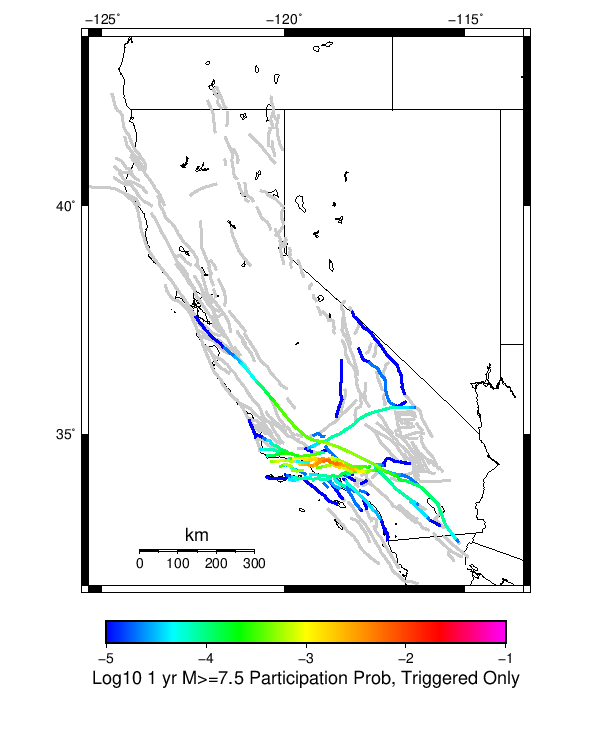 | 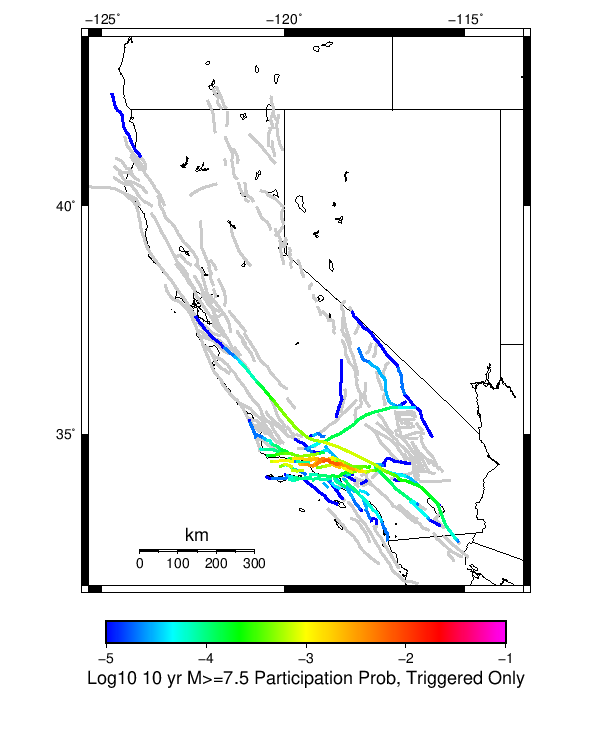 | 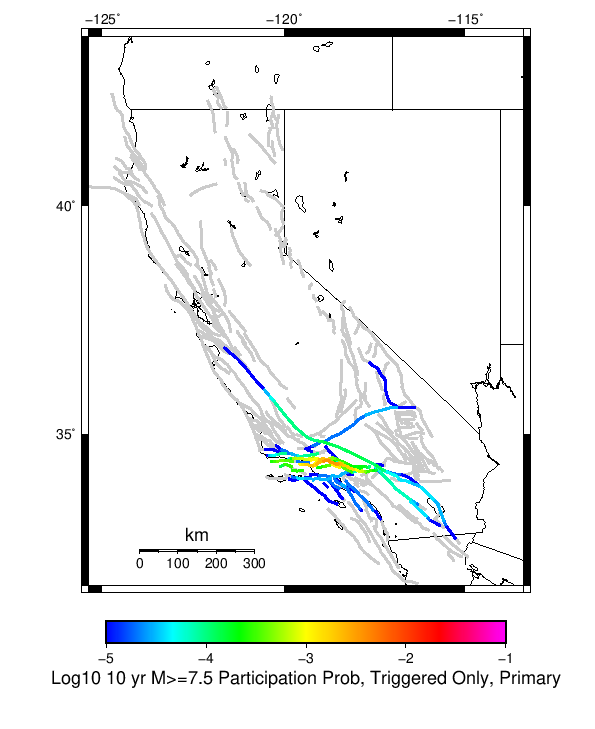 |
| M≥8 | 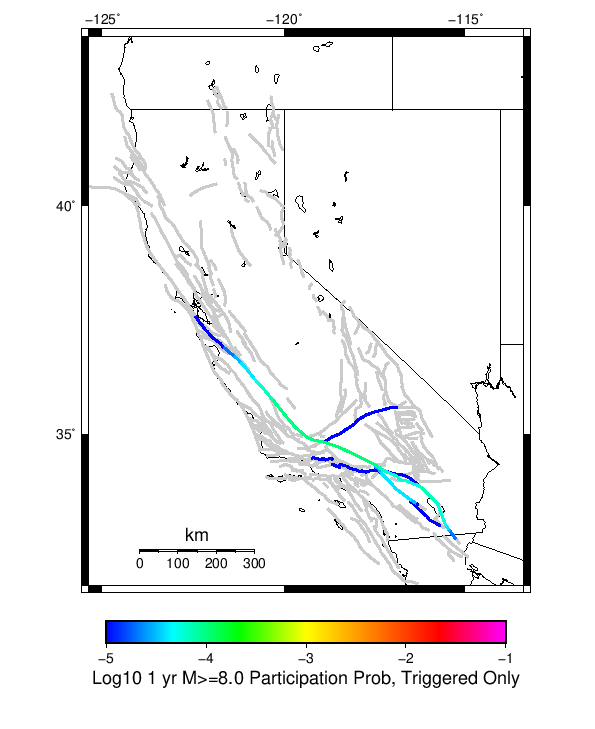 |  |  |
Supra-Seismogenic Parent Sections Table
First 10 of 189 with matching ruptures shown
| Parent Name | Triggered 10 Year Mean Count | Triggered 1 Day Prob | Triggered 1 Day 95% Conf | Triggered 1 Week Prob | Triggered 1 Week 95% Conf | Triggered 1 Month Prob | Triggered 1 Month 95% Conf | Triggered 1 Year Prob | Triggered 1 Year 95% Conf | Triggered 10 Year Prob | Triggered 10 Year 95% Conf | Triggered 10 Year Primary Mean Count |
|---|---|---|---|---|---|---|---|---|---|---|---|---|
| Santa Susana East (connector) | 0.06506 | 0.024 (2.41%) | [2.32% 2.51%] | 0.034 (3.36%) | [3.25% 3.47%] | 0.041 (4.09%) | [3.97% 4.21%] | 0.053 (5.29%) | [5.15% 5.43%] | 0.064 (6.40%) | [6.24% 6.55%] | 0.03693 |
| Mission Hills 2011 | 0.04466 | 0.016 (1.57%) | [1.49% 1.65%] | 0.022 (2.20%) | [2.11% 2.30%] | 0.027 (2.73%) | [2.63% 2.83%] | 0.036 (3.64%) | [3.52% 3.75%] | 0.045 (4.46%) | [4.33% 4.59%] | 0.0244 |
| Santa Susana alt 1 | 0.04023 | 0.014 (1.40%) | [1.33% 1.48%] | 0.020 (1.99%) | [1.91% 2.08%] | 0.025 (2.48%) | [2.39% 2.58%] | 0.033 (3.26%) | [3.15% 3.37%] | 0.040 (4.00%) | [3.88% 4.12%] | 0.02158 |
| Oak Ridge (Onshore) | 0.01542 | 4.38E-3 (0.44%) | [0.40% 0.48%] | 6.32E-3 (0.63%) | [0.58% 0.68%] | 8.08E-3 (0.81%) | [0.75% 0.87%] | 0.011 (1.14%) | [1.07% 1.21%] | 0.014 (1.44%) | [1.36% 1.51%] | 0.00679 |
| Simi-Santa Rosa | 0.00941 | 1.92E-3 (0.19%) | [0.17% 0.22%] | 3.20E-3 (0.32%) | [0.29% 0.36%] | 4.16E-3 (0.42%) | [0.38% 0.46%] | 6.58E-3 (0.66%) | [0.61% 0.71%] | 8.97E-3 (0.90%) | [0.84% 0.96%] | 0.00231 |
| San Cayetano | 0.00895 | 2.80E-3 (0.28%) | [0.25% 0.32%] | 3.80E-3 (0.38%) | [0.34% 0.42%] | 5.00E-3 (0.50%) | [0.46% 0.55%] | 6.88E-3 (0.69%) | [0.64% 0.74%] | 8.69E-3 (0.87%) | [0.81% 0.93%] | 0.00406 |
| Ventura-Pitas Point | 0.00787 | 2.00E-3 (0.20%) | [0.17% 0.23%] | 2.88E-3 (0.29%) | [0.26% 0.32%] | 3.81E-3 (0.38%) | [0.34% 0.42%] | 5.55E-3 (0.56%) | [0.51% 0.60%] | 7.12E-3 (0.71%) | [0.66% 0.77%] | 0.00285 |
| Santa Ynez (East) | 0.00678 | 1.12E-3 (0.11%) | [0.09% 0.14%] | 1.94E-3 (0.19%) | [0.17% 0.22%] | 2.74E-3 (0.27%) | [0.24% 0.31%] | 4.29E-3 (0.43%) | [0.39% 0.47%] | 6.21E-3 (0.62%) | [0.57% 0.67%] | 4.7E-4 |
| Sierra Madre (San Fernando) | 0.0066 | 1.99E-3 (0.20%) | [0.17% 0.23%] | 2.95E-3 (0.29%) | [0.26% 0.33%] | 3.69E-3 (0.37%) | [0.33% 0.41%] | 5.20E-3 (0.52%) | [0.48% 0.57%] | 6.49E-3 (0.65%) | [0.60% 0.70%] | 0.00359 |
| Holser alt 1 | 0.00645 | 1.95E-3 (0.19%) | [0.17% 0.22%] | 2.81E-3 (0.28%) | [0.25% 0.32%] | 3.58E-3 (0.36%) | [0.32% 0.40%] | 4.85E-3 (0.48%) | [0.44% 0.53%] | 6.43E-3 (0.64%) | [0.59% 0.69%] | 0.00299 |
M≥6.5 Parent Sections Table
First 10 of 164 with matching ruptures shown
| Parent Name | Triggered 10 Year Mean Count | Triggered 1 Day Prob | Triggered 1 Day 95% Conf | Triggered 1 Week Prob | Triggered 1 Week 95% Conf | Triggered 1 Month Prob | Triggered 1 Month 95% Conf | Triggered 1 Year Prob | Triggered 1 Year 95% Conf | Triggered 10 Year Prob | Triggered 10 Year 95% Conf | Triggered 10 Year Primary Mean Count |
|---|---|---|---|---|---|---|---|---|---|---|---|---|
| Santa Susana alt 1 | 0.04023 | 0.014 (1.40%) | [1.33% 1.48%] | 0.020 (1.99%) | [1.91% 2.08%] | 0.025 (2.48%) | [2.39% 2.58%] | 0.033 (3.26%) | [3.15% 3.37%] | 0.040 (4.00%) | [3.88% 4.12%] | 0.02158 |
| Santa Susana East (connector) | 0.03543 | 0.013 (1.25%) | [1.18% 1.32%] | 0.018 (1.79%) | [1.71% 1.87%] | 0.022 (2.22%) | [2.13% 2.32%] | 0.029 (2.88%) | [2.78% 2.99%] | 0.035 (3.51%) | [3.40% 3.63%] | 0.01921 |
| Oak Ridge (Onshore) | 0.01542 | 4.38E-3 (0.44%) | [0.40% 0.48%] | 6.32E-3 (0.63%) | [0.58% 0.68%] | 8.08E-3 (0.81%) | [0.75% 0.87%] | 0.011 (1.14%) | [1.07% 1.21%] | 0.014 (1.44%) | [1.36% 1.51%] | 0.00679 |
| San Cayetano | 0.00895 | 2.80E-3 (0.28%) | [0.25% 0.32%] | 3.80E-3 (0.38%) | [0.34% 0.42%] | 5.00E-3 (0.50%) | [0.46% 0.55%] | 6.88E-3 (0.69%) | [0.64% 0.74%] | 8.69E-3 (0.87%) | [0.81% 0.93%] | 0.00406 |
| Ventura-Pitas Point | 0.0067 | 1.89E-3 (0.19%) | [0.16% 0.22%] | 2.74E-3 (0.27%) | [0.24% 0.31%] | 3.58E-3 (0.36%) | [0.32% 0.40%] | 5.11E-3 (0.51%) | [0.47% 0.56%] | 6.43E-3 (0.64%) | [0.59% 0.69%] | 0.00278 |
| Sierra Madre (San Fernando) | 0.0066 | 1.99E-3 (0.20%) | [0.17% 0.23%] | 2.95E-3 (0.29%) | [0.26% 0.33%] | 3.69E-3 (0.37%) | [0.33% 0.41%] | 5.20E-3 (0.52%) | [0.48% 0.57%] | 6.49E-3 (0.65%) | [0.60% 0.70%] | 0.00359 |
| Holser alt 1 | 0.00645 | 1.95E-3 (0.19%) | [0.17% 0.22%] | 2.81E-3 (0.28%) | [0.25% 0.32%] | 3.58E-3 (0.36%) | [0.32% 0.40%] | 4.85E-3 (0.48%) | [0.44% 0.53%] | 6.43E-3 (0.64%) | [0.59% 0.69%] | 0.00299 |
| Northridge | 0.00565 | 1.81E-3 (0.18%) | [0.16% 0.21%] | 2.56E-3 (0.26%) | [0.23% 0.29%] | 3.13E-3 (0.31%) | [0.28% 0.35%] | 4.37E-3 (0.44%) | [0.40% 0.48%] | 5.52E-3 (0.55%) | [0.51% 0.60%] | 0.00277 |
| Simi-Santa Rosa | 0.00535 | 1.18E-3 (0.12%) | [0.10% 0.14%] | 1.92E-3 (0.19%) | [0.17% 0.22%] | 2.50E-3 (0.25%) | [0.22% 0.28%] | 3.89E-3 (0.39%) | [0.35% 0.43%] | 5.22E-3 (0.52%) | [0.48% 0.57%] | 0.00148 |
| Mission Hills 2011 | 0.00472 | 1.69E-3 (0.17%) | [0.14% 0.20%] | 2.32E-3 (0.23%) | [0.20% 0.26%] | 2.75E-3 (0.27%) | [0.24% 0.31%] | 3.86E-3 (0.39%) | [0.35% 0.43%] | 4.72E-3 (0.47%) | [0.43% 0.52%] | 0.00249 |
M≥7 Parent Sections Table
First 10 of 131 with matching ruptures shown
| Parent Name | Triggered 10 Year Mean Count | Triggered 1 Day Prob | Triggered 1 Day 95% Conf | Triggered 1 Week Prob | Triggered 1 Week 95% Conf | Triggered 1 Month Prob | Triggered 1 Month 95% Conf | Triggered 1 Year Prob | Triggered 1 Year 95% Conf | Triggered 10 Year Prob | Triggered 10 Year 95% Conf | Triggered 10 Year Primary Mean Count |
|---|---|---|---|---|---|---|---|---|---|---|---|---|
| Oak Ridge (Onshore) | 0.01423 | 4.23E-3 (0.42%) | [0.38% 0.47%] | 6.09E-3 (0.61%) | [0.56% 0.66%] | 7.77E-3 (0.78%) | [0.72% 0.83%] | 0.011 (1.08%) | [1.02% 1.15%] | 0.014 (1.36%) | [1.29% 1.44%] | 0.00663 |
| Santa Susana alt 1 | 0.01373 | 4.31E-3 (0.43%) | [0.39% 0.47%] | 6.26E-3 (0.63%) | [0.58% 0.68%] | 8.02E-3 (0.80%) | [0.75% 0.86%] | 0.011 (1.10%) | [1.03% 1.16%] | 0.014 (1.36%) | [1.29% 1.44%] | 0.00705 |
| Santa Susana East (connector) | 0.00962 | 2.97E-3 (0.30%) | [0.26% 0.33%] | 4.42E-3 (0.44%) | [0.40% 0.49%] | 5.61E-3 (0.56%) | [0.52% 0.61%] | 7.67E-3 (0.77%) | [0.71% 0.82%] | 9.57E-3 (0.96%) | [0.90% 1.02%] | 0.00501 |
| San Cayetano | 0.00887 | 2.78E-3 (0.28%) | [0.25% 0.31%] | 3.78E-3 (0.38%) | [0.34% 0.42%] | 4.97E-3 (0.50%) | [0.45% 0.54%] | 6.85E-3 (0.69%) | [0.64% 0.74%] | 8.65E-3 (0.86%) | [0.81% 0.92%] | 0.00405 |
| Sierra Madre (San Fernando) | 0.00599 | 1.80E-3 (0.18%) | [0.16% 0.21%] | 2.67E-3 (0.27%) | [0.24% 0.30%] | 3.33E-3 (0.33%) | [0.30% 0.37%] | 4.70E-3 (0.47%) | [0.43% 0.51%] | 5.91E-3 (0.59%) | [0.54% 0.64%] | 0.00329 |
| Ventura-Pitas Point | 0.00565 | 1.81E-3 (0.18%) | [0.16% 0.21%] | 2.52E-3 (0.25%) | [0.22% 0.29%] | 3.26E-3 (0.33%) | [0.29% 0.36%] | 4.48E-3 (0.45%) | [0.41% 0.49%] | 5.56E-3 (0.56%) | [0.51% 0.60%] | 0.00267 |
| Sierra Madre | 0.00452 | 1.32E-3 (0.13%) | [0.11% 0.16%] | 1.95E-3 (0.19%) | [0.17% 0.22%] | 2.42E-3 (0.24%) | [0.21% 0.27%] | 3.55E-3 (0.36%) | [0.32% 0.39%] | 4.44E-3 (0.44%) | [0.40% 0.49%] | 0.00234 |
| Northridge Hills | 0.00402 | 1.44E-3 (0.14%) | [0.12% 0.17%] | 1.96E-3 (0.20%) | [0.17% 0.23%] | 2.34E-3 (0.23%) | [0.21% 0.27%] | 3.27E-3 (0.33%) | [0.29% 0.36%] | 4.01E-3 (0.40%) | [0.36% 0.44%] | 0.00207 |
| Mission Ridge-Arroyo Parida-Santa Ana | 0.00345 | 1.03E-3 (0.10%) | [0.08% 0.13%] | 1.42E-3 (0.14%) | [0.12% 0.17%] | 1.80E-3 (0.18%) | [0.16% 0.21%] | 2.63E-3 (0.26%) | [0.23% 0.30%] | 3.34E-3 (0.33%) | [0.30% 0.37%] | 0.0015 |
| Northridge | 0.00311 | 8.80E-4 (0.09%) | [0.07% 0.11%] | 1.27E-3 (0.13%) | [0.11% 0.15%] | 1.58E-3 (0.16%) | [0.13% 0.19%] | 2.27E-3 (0.23%) | [0.20% 0.26%] | 3.04E-3 (0.30%) | [0.27% 0.34%] | 0.00133 |
M≥7.5 Parent Sections Table
First 10 of 107 with matching ruptures shown
| Parent Name | Triggered 10 Year Mean Count | Triggered 1 Day Prob | Triggered 1 Day 95% Conf | Triggered 1 Week Prob | Triggered 1 Week 95% Conf | Triggered 1 Month Prob | Triggered 1 Month 95% Conf | Triggered 1 Year Prob | Triggered 1 Year 95% Conf | Triggered 10 Year Prob | Triggered 10 Year 95% Conf | Triggered 10 Year Primary Mean Count |
|---|---|---|---|---|---|---|---|---|---|---|---|---|
| Oak Ridge (Onshore) | 0.00794 | 2.39E-3 (0.24%) | [0.21% 0.27%] | 3.37E-3 (0.34%) | [0.30% 0.38%] | 4.30E-3 (0.43%) | [0.39% 0.47%] | 6.17E-3 (0.62%) | [0.57% 0.67%] | 7.79E-3 (0.78%) | [0.73% 0.84%] | 0.00392 |
| Santa Susana alt 1 | 0.00688 | 2.05E-3 (0.21%) | [0.18% 0.24%] | 2.91E-3 (0.29%) | [0.26% 0.33%] | 3.77E-3 (0.38%) | [0.34% 0.42%] | 5.37E-3 (0.54%) | [0.49% 0.58%] | 6.83E-3 (0.68%) | [0.63% 0.74%] | 0.0035 |
| San Cayetano | 0.00482 | 1.51E-3 (0.15%) | [0.13% 0.18%] | 1.99E-3 (0.20%) | [0.17% 0.23%] | 2.64E-3 (0.26%) | [0.23% 0.30%] | 3.69E-3 (0.37%) | [0.33% 0.41%] | 4.72E-3 (0.47%) | [0.43% 0.52%] | 0.00217 |
| Santa Susana East (connector) | 0.00443 | 1.26E-3 (0.13%) | [0.11% 0.15%] | 1.86E-3 (0.19%) | [0.16% 0.22%] | 2.42E-3 (0.24%) | [0.21% 0.27%] | 3.45E-3 (0.34%) | [0.31% 0.38%] | 4.41E-3 (0.44%) | [0.40% 0.48%] | 0.00228 |
| Ventura-Pitas Point | 0.00439 | 1.45E-3 (0.14%) | [0.12% 0.17%] | 2.01E-3 (0.20%) | [0.17% 0.23%] | 2.59E-3 (0.26%) | [0.23% 0.29%] | 3.58E-3 (0.36%) | [0.32% 0.40%] | 4.36E-3 (0.44%) | [0.40% 0.48%] | 0.00215 |
| Sierra Madre (San Fernando) | 0.00364 | 1.00E-3 (0.10%) | [0.08% 0.12%] | 1.50E-3 (0.15%) | [0.13% 0.18%] | 1.88E-3 (0.19%) | [0.16% 0.22%] | 2.78E-3 (0.28%) | [0.25% 0.31%] | 3.60E-3 (0.36%) | [0.32% 0.40%] | 0.00195 |
| Sierra Madre | 0.00332 | 9.20E-4 (0.09%) | [0.07% 0.11%] | 1.38E-3 (0.14%) | [0.12% 0.16%] | 1.72E-3 (0.17%) | [0.15% 0.20%] | 2.56E-3 (0.26%) | [0.23% 0.29%] | 3.30E-3 (0.33%) | [0.30% 0.37%] | 0.0017 |
| Northridge Hills | 0.00215 | 7.90E-4 (0.08%) | [0.06% 0.10%] | 1.07E-3 (0.11%) | [0.09% 0.13%] | 1.27E-3 (0.13%) | [0.11% 0.15%] | 1.77E-3 (0.18%) | [0.15% 0.21%] | 2.15E-3 (0.21%) | [0.19% 0.25%] | 0.00115 |
| Mission Ridge-Arroyo Parida-Santa Ana | 0.00211 | 6.30E-4 (0.06%) | [0.05% 0.08%] | 8.80E-4 (0.09%) | [0.07% 0.11%] | 1.10E-3 (0.11%) | [0.09% 0.13%] | 1.58E-3 (0.16%) | [0.13% 0.19%] | 2.09E-3 (0.21%) | [0.18% 0.24%] | 9.3E-4 |
| Sisar | 0.00209 | 6.50E-4 (0.07%) | [0.05% 0.08%] | 9.20E-4 (0.09%) | [0.07% 0.11%] | 1.13E-3 (0.11%) | [0.09% 0.14%] | 1.71E-3 (0.17%) | [0.15% 0.20%] | 2.09E-3 (0.21%) | [0.18% 0.24%] | 0.00102 |
M≥8 Parent Sections Table
First 10 of 34 with matching ruptures shown
| Parent Name | Triggered 10 Year Mean Count | Triggered 1 Day Prob | Triggered 1 Day 95% Conf | Triggered 1 Week Prob | Triggered 1 Week 95% Conf | Triggered 1 Month Prob | Triggered 1 Month 95% Conf | Triggered 1 Year Prob | Triggered 1 Year 95% Conf | Triggered 10 Year Prob | Triggered 10 Year 95% Conf | Triggered 10 Year Primary Mean Count |
|---|---|---|---|---|---|---|---|---|---|---|---|---|
| San Andreas (Mojave N) | 1.4E-4 | 6.00E-5 (0.01%) | [0.00% 0.01%] | 8.00E-5 (0.01%) | [0.00% 0.02%] | 1.00E-4 (0.01%) | [0.01% 0.02%] | 1.10E-4 (0.01%) | [0.01% 0.02%] | 1.40E-4 (0.01%) | [0.01% 0.02%] | 5.0E-5 |
| San Andreas (Mojave S) | 1.4E-4 | 6.00E-5 (0.01%) | [0.00% 0.01%] | 8.00E-5 (0.01%) | [0.00% 0.02%] | 1.00E-4 (0.01%) | [0.01% 0.02%] | 1.10E-4 (0.01%) | [0.01% 0.02%] | 1.40E-4 (0.01%) | [0.01% 0.02%] | 5.0E-5 |
| San Andreas (Big Bend) | 1.3E-4 | 5.00E-5 (0.01%) | [0.00% 0.01%] | 7.00E-5 (0.01%) | [0.00% 0.02%] | 9.00E-5 (0.01%) | [0.00% 0.02%] | 1.00E-4 (0.01%) | [0.01% 0.02%] | 1.30E-4 (0.01%) | [0.01% 0.02%] | 4.0E-5 |
| San Andreas (Carrizo) rev | 1.3E-4 | 5.00E-5 (0.01%) | [0.00% 0.01%] | 7.00E-5 (0.01%) | [0.00% 0.02%] | 9.00E-5 (0.01%) | [0.00% 0.02%] | 1.00E-4 (0.01%) | [0.01% 0.02%] | 1.30E-4 (0.01%) | [0.01% 0.02%] | 4.0E-5 |
| San Andreas (Cholame) rev | 1.3E-4 | 5.00E-5 (0.01%) | [0.00% 0.01%] | 7.00E-5 (0.01%) | [0.00% 0.02%] | 9.00E-5 (0.01%) | [0.00% 0.02%] | 1.00E-4 (0.01%) | [0.01% 0.02%] | 1.30E-4 (0.01%) | [0.01% 0.02%] | 4.0E-5 |
| San Andreas (San Bernardino N) | 1.3E-4 | 6.00E-5 (0.01%) | [0.00% 0.01%] | 8.00E-5 (0.01%) | [0.00% 0.02%] | 1.00E-4 (0.01%) | [0.01% 0.02%] | 1.00E-4 (0.01%) | [0.01% 0.02%] | 1.30E-4 (0.01%) | [0.01% 0.02%] | 5.0E-5 |
| San Andreas (Parkfield) | 1.0E-4 | 2.00E-5 (0.00%) | [0.00% 0.01%] | 4.00E-5 (0.00%) | [0.00% 0.01%] | 6.00E-5 (0.01%) | [0.00% 0.01%] | 7.00E-5 (0.01%) | [0.00% 0.02%] | 1.00E-4 (0.01%) | [0.01% 0.02%] | 2.0E-5 |
| San Andreas (Coachella) rev | 9.0E-5 | 4.00E-5 (0.00%) | [0.00% 0.01%] | 5.00E-5 (0.01%) | [0.00% 0.01%] | 7.00E-5 (0.01%) | [0.00% 0.02%] | 7.00E-5 (0.01%) | [0.00% 0.02%] | 9.00E-5 (0.01%) | [0.00% 0.02%] | 3.0E-5 |
| Brawley (Seismic Zone) alt 1 | 8.0E-5 | 3.00E-5 (0.00%) | [0.00% 0.01%] | 4.00E-5 (0.00%) | [0.00% 0.01%] | 6.00E-5 (0.01%) | [0.00% 0.01%] | 6.00E-5 (0.01%) | [0.00% 0.01%] | 8.00E-5 (0.01%) | [0.00% 0.02%] | 2.0E-5 |
| San Andreas (Creeping Section) 2011 CFM | 8.0E-5 | 1.00E-5 (0.00%) | [0.00% 0.01%] | 3.00E-5 (0.00%) | [0.00% 0.01%] | 5.00E-5 (0.01%) | [0.00% 0.01%] | 6.00E-5 (0.01%) | [0.00% 0.01%] | 8.00E-5 (0.01%) | [0.00% 0.02%] | 1.0E-5 |
Fault Magnitude-Probability Distributions
The first 5 sections (sorted by trigger rate) are plotted below. All fault MPDs are available here
| 1 Week | 1 Month | 1 Year | 10 Year |
|---|---|---|---|
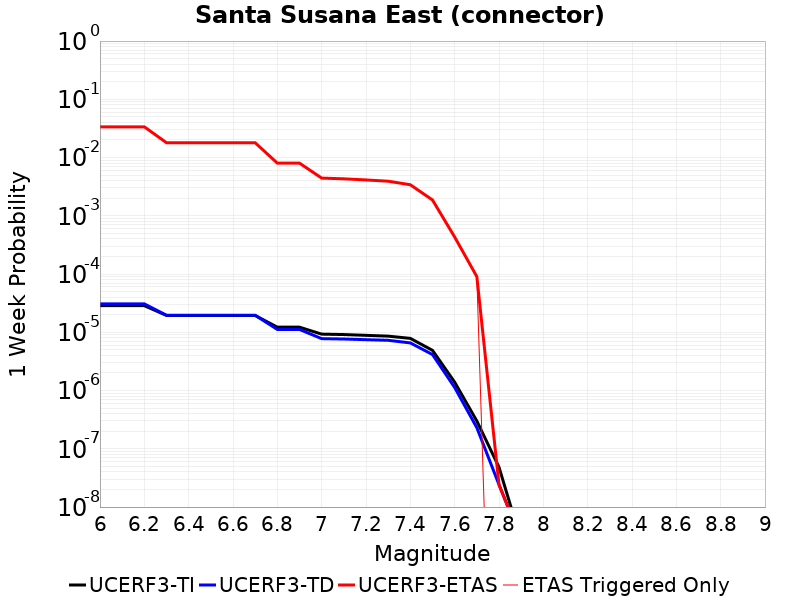 | 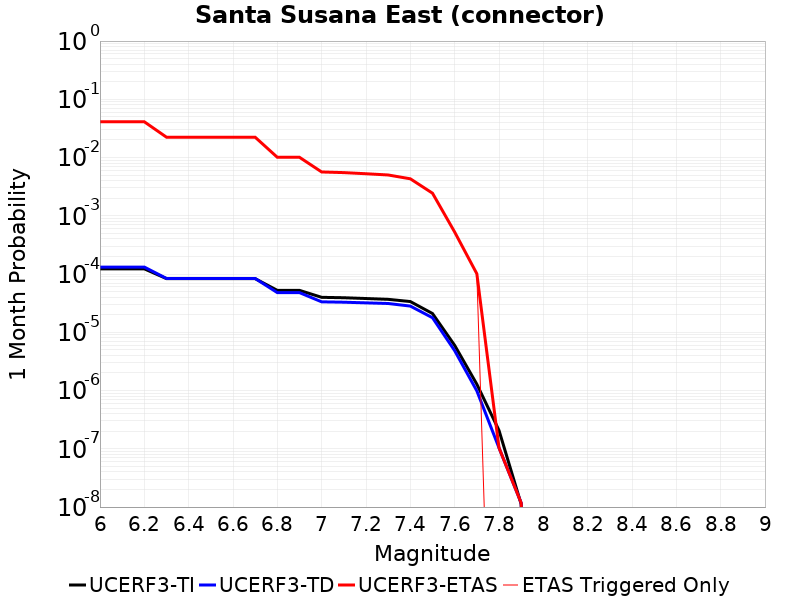 | 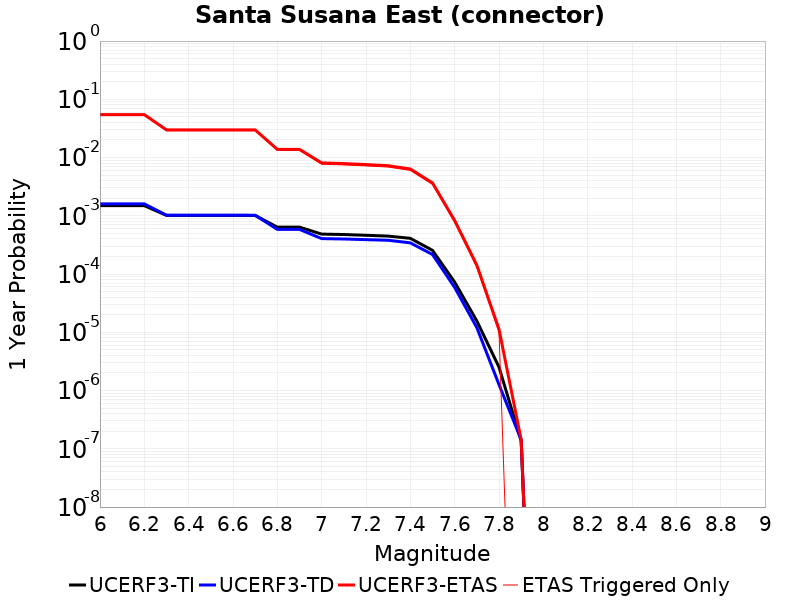 | 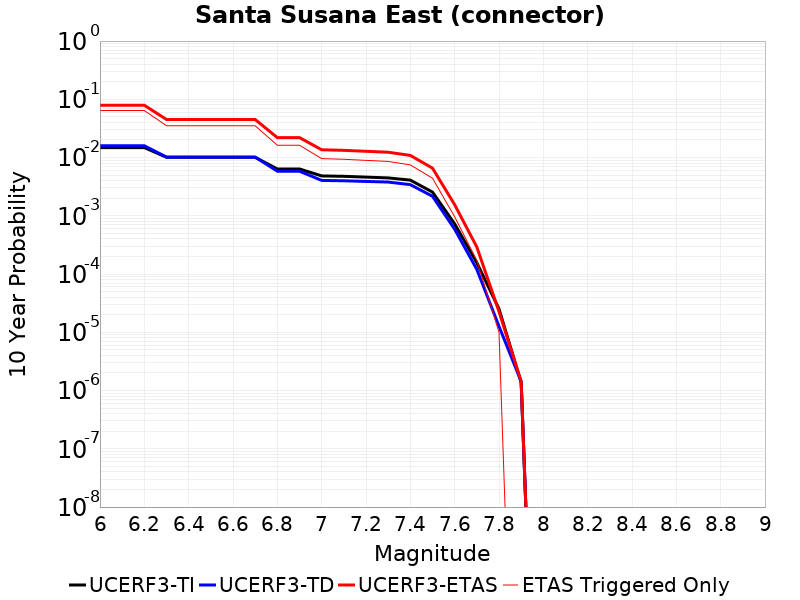 |
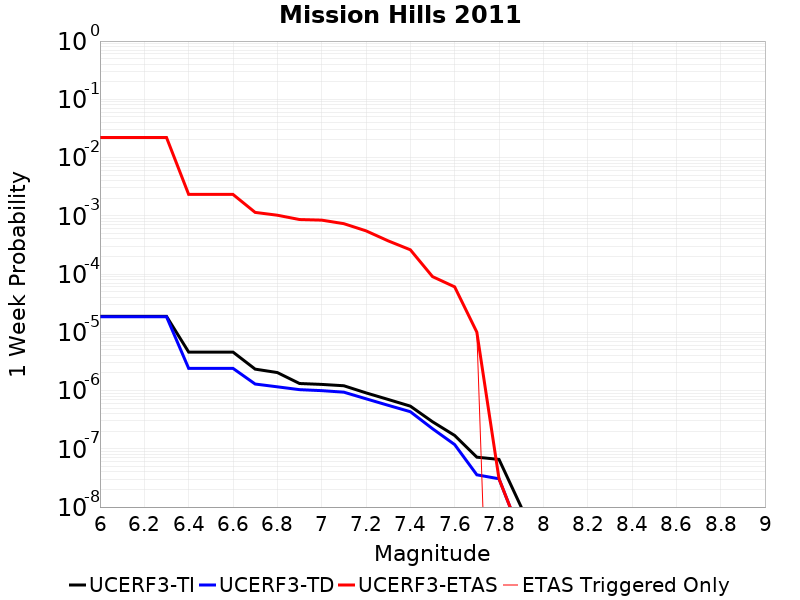 | 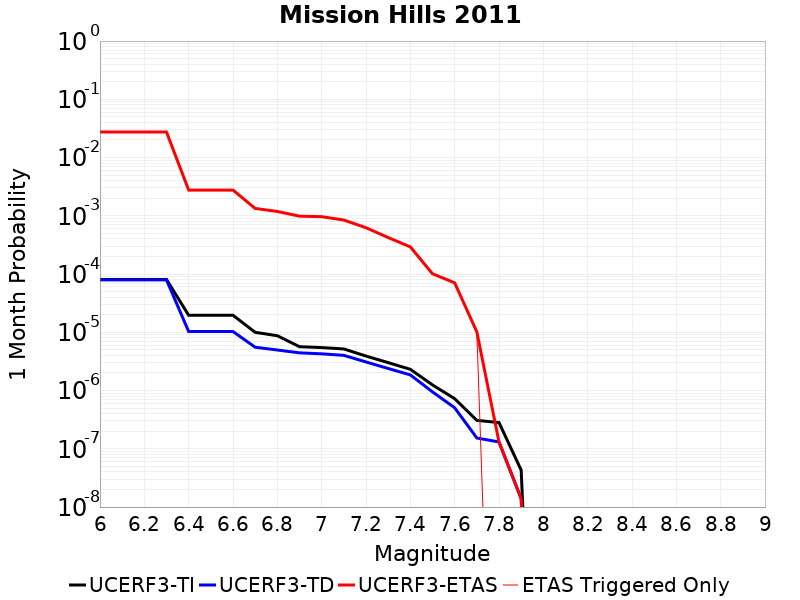 | 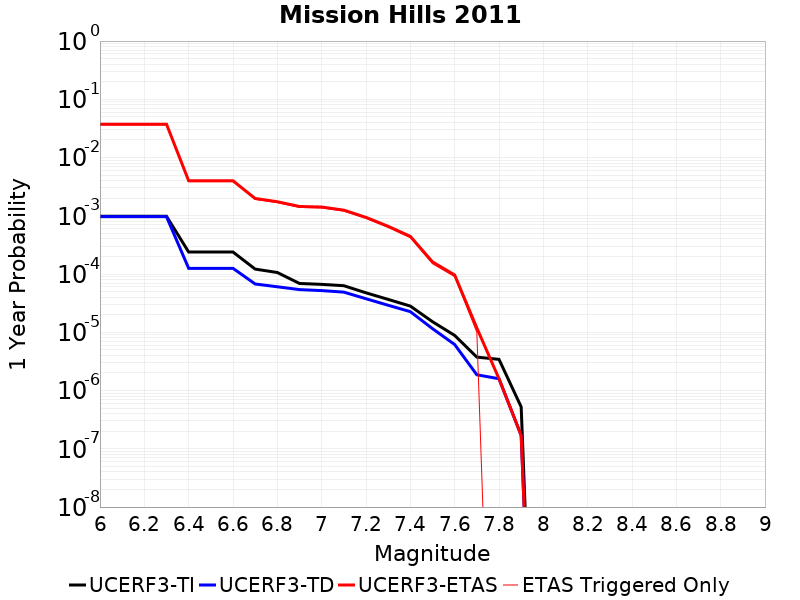 | 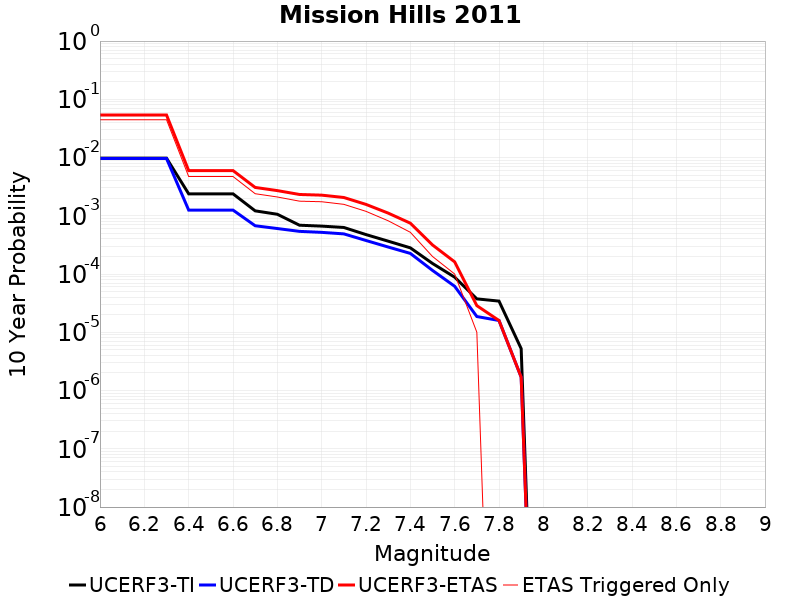 |
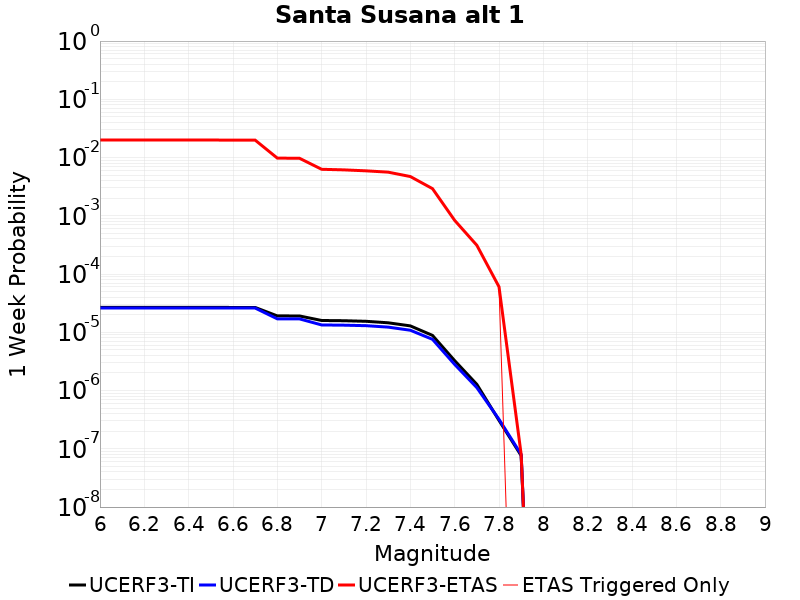 | 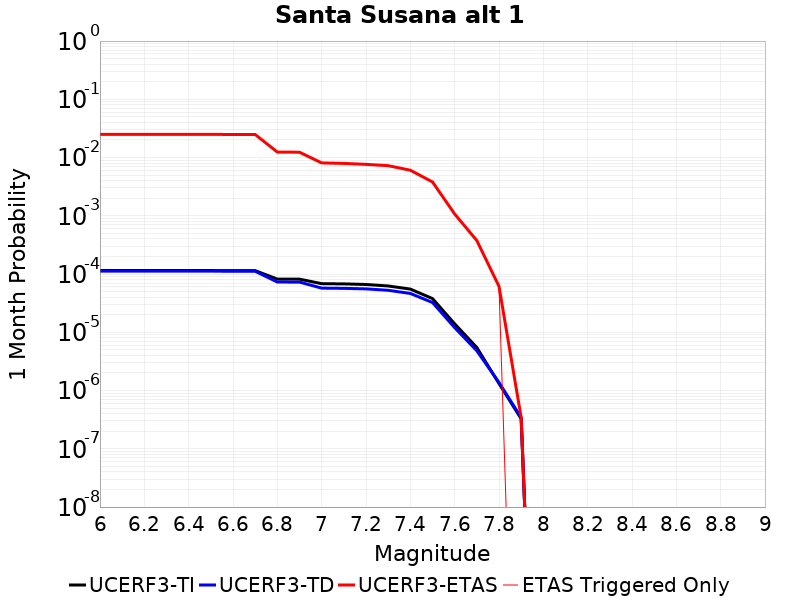 | 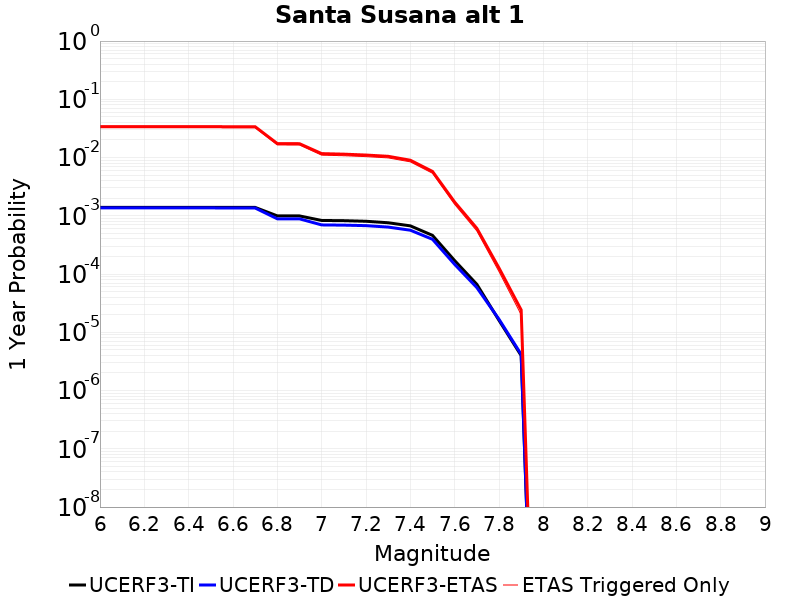 | 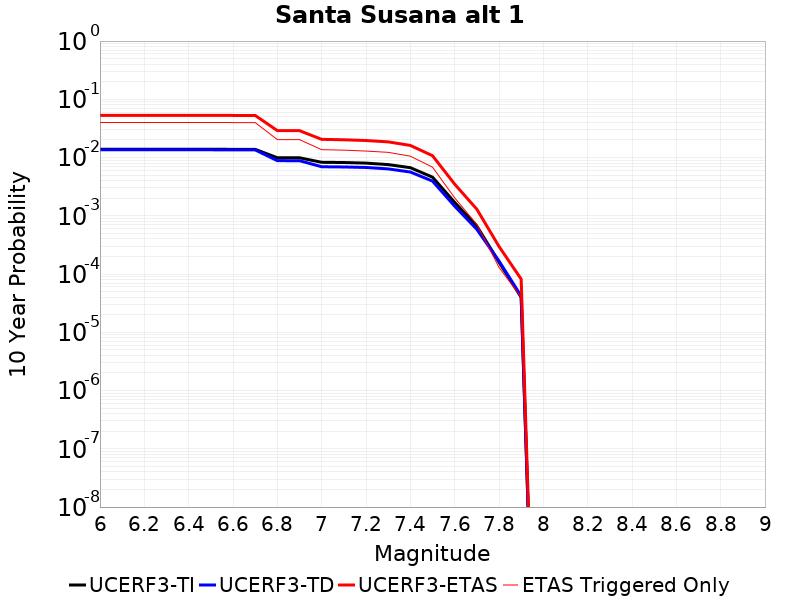 |
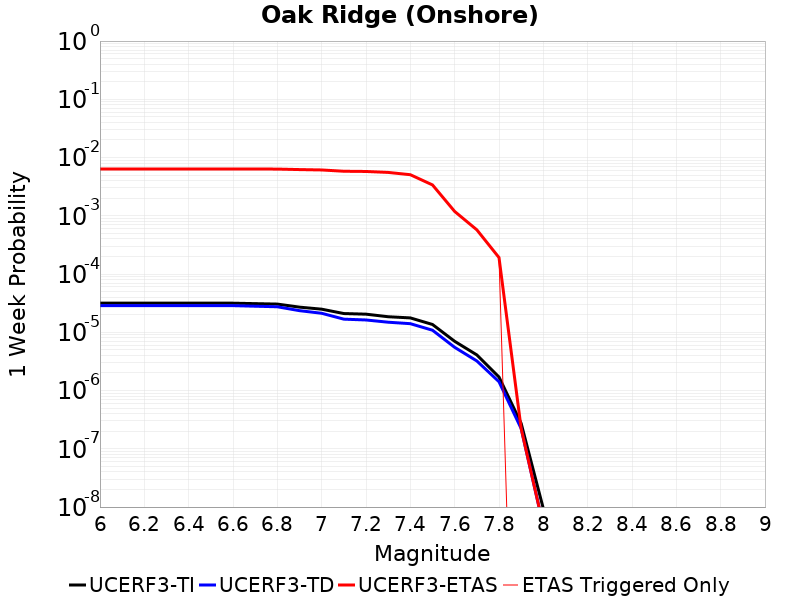 | 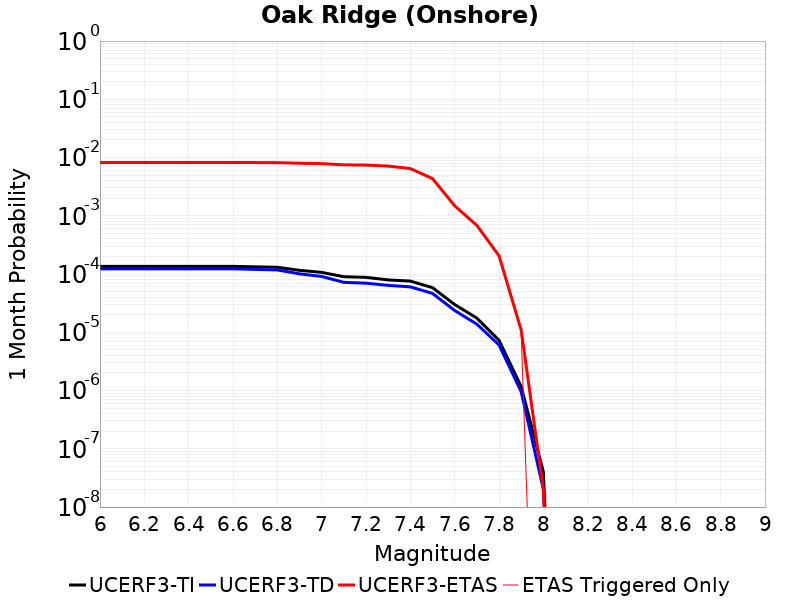 | 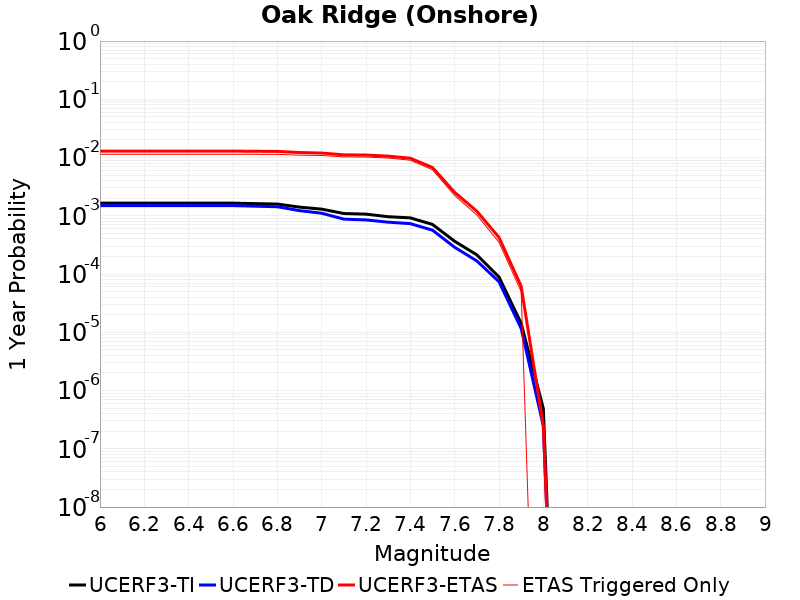 | 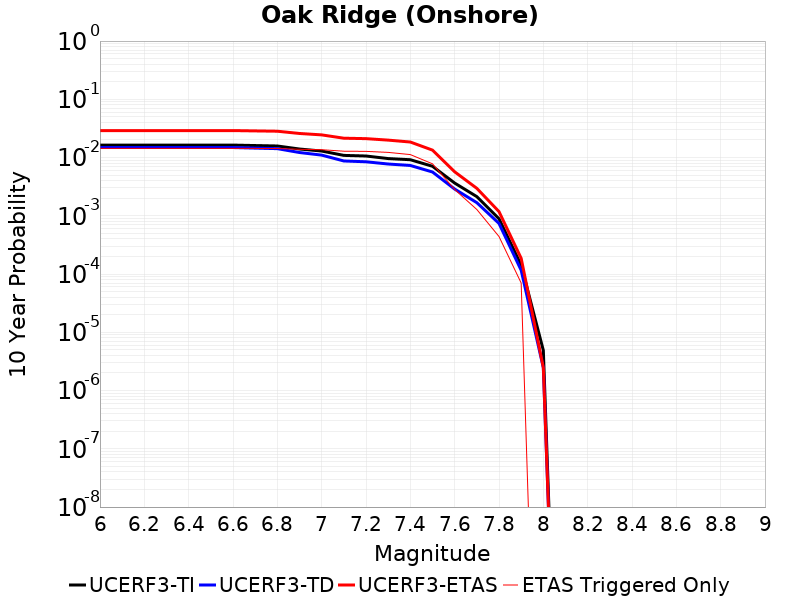 |
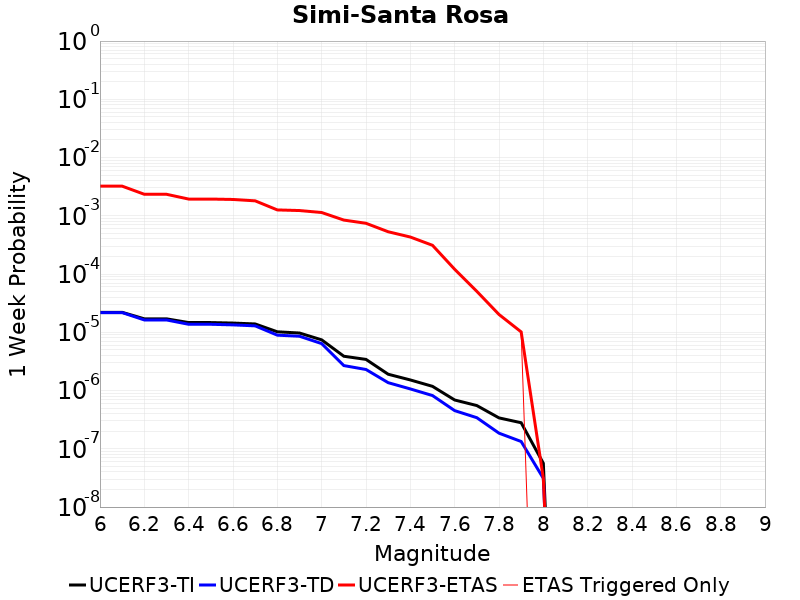 | 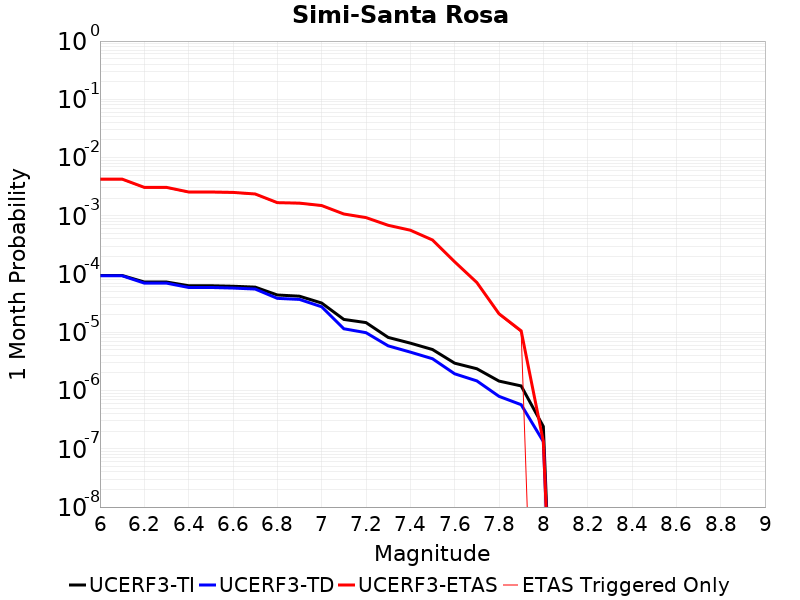 | 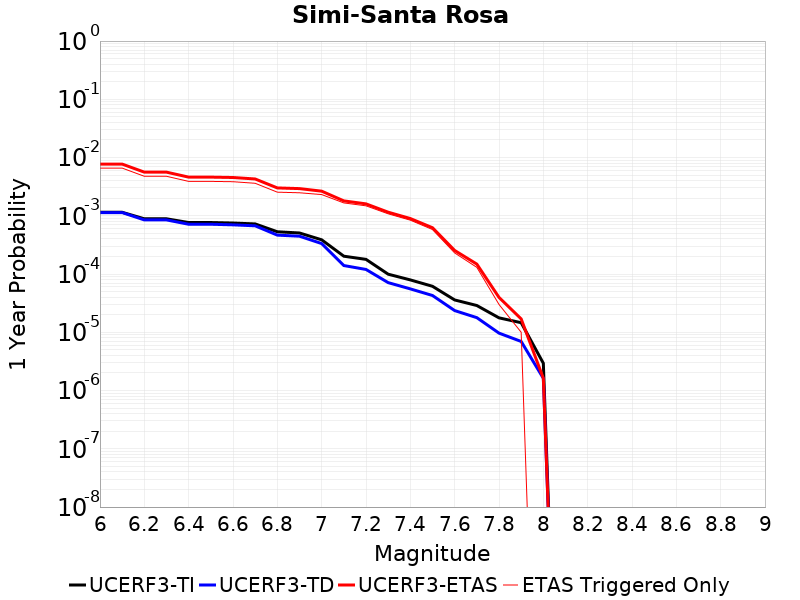 | 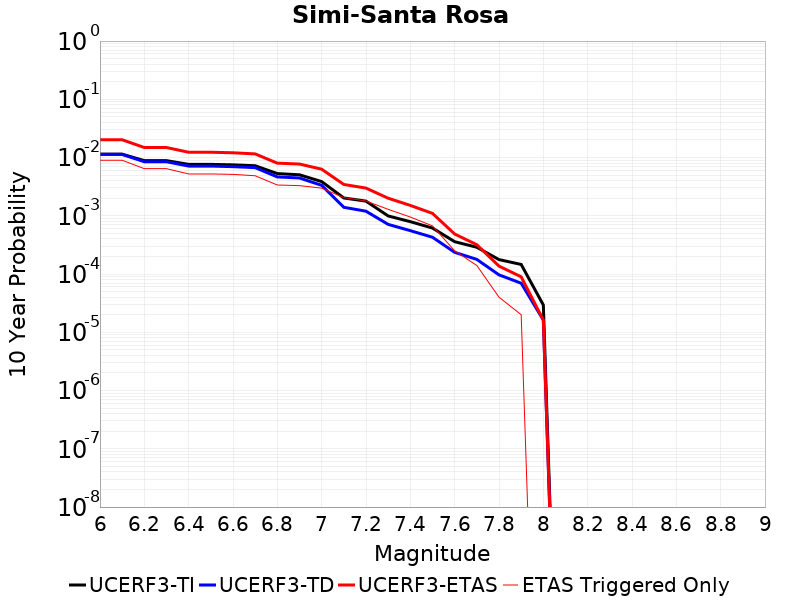 |
Gridded Nucleation
| Min Mag | Triggered Ruptures (no spontaneous) | Triggered Ruptures (primary aftershocks only) |
|---|---|---|
| M≥2.5 | 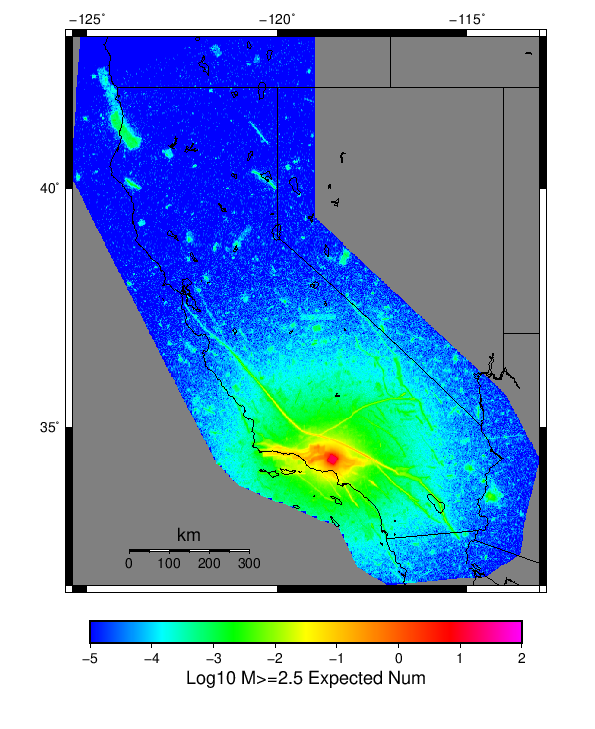 | 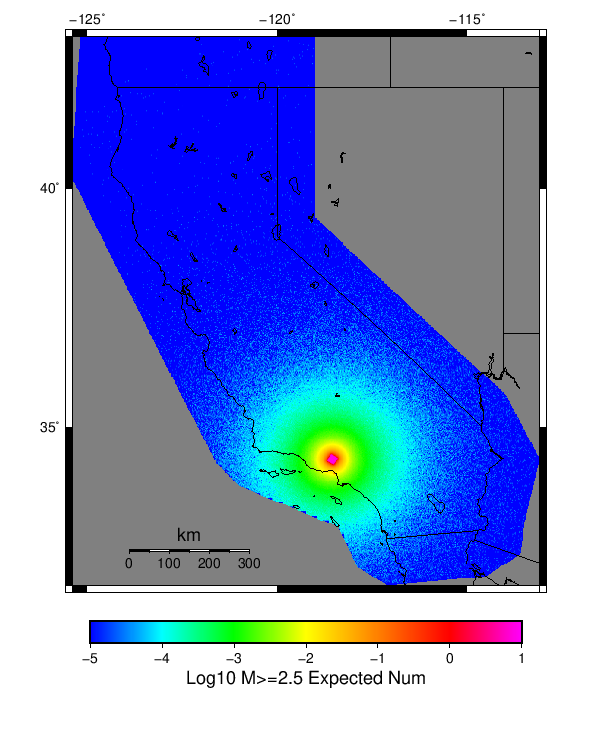 |
| M≥5 | 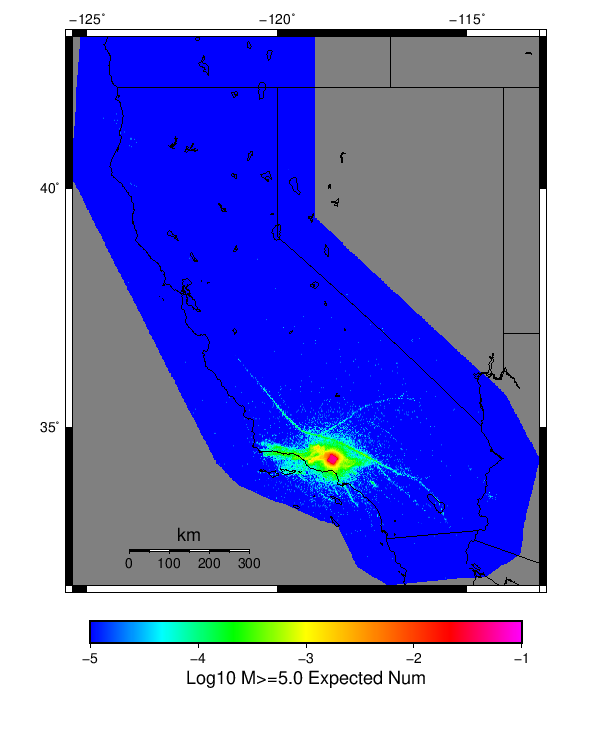 | 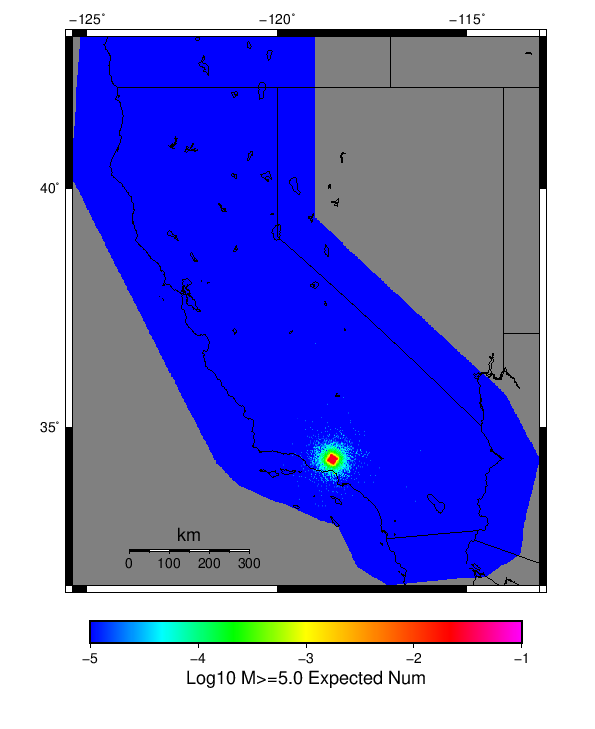 |
| M≥6 | 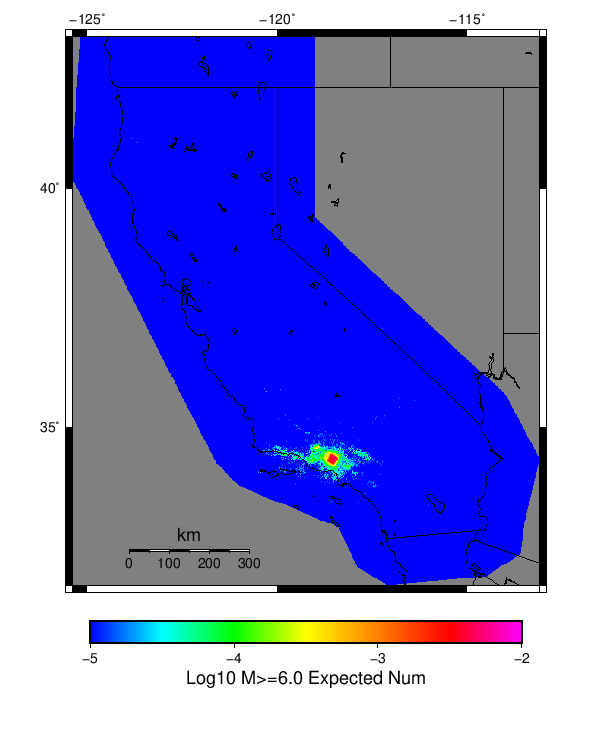 |  |
| M≥7 | 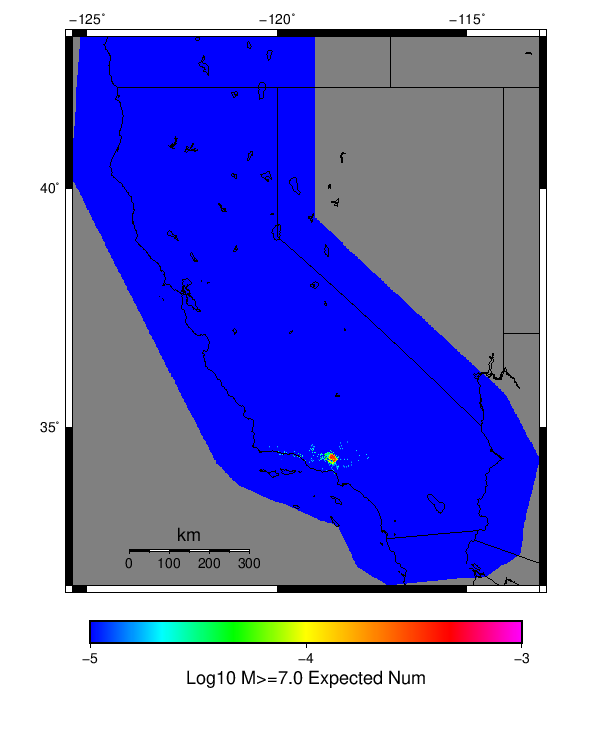 |  |
JSON Input File
{
  "numSimulations": 100000,
  "duration": 10.0,
  "startTimeMillis": 758809856390,
  "includeSpontaneous": false,
  "randomSeed": 123456789,
  "binaryOutput": true,
  "binaryOutputFilters": [
    {
      "prefix": "results_complete",
      "descendantsOnly": false
    },
    {
      "prefix": "results_m5_preserve_chain",
      "minMag": 5.0,
      "preserveChainBelowMag": true,
      "descendantsOnly": false
    }
  ],
  "forceRecalc": false,
  "simulationName": "ComCat M6.7 (ci3144585), ShakeMap Surface, kCOV\u003d1.5, MaxPtSrcM\u003d5",
  "numRetries": 3,
  "outputDir": "/expanse/lustre/projects/ddp408/ux454496/ucerf3_etas_test_cases/benchmark_1/data/20241017T210255-34546712",
  "treatTriggerCatalogAsSpontaneous": false,
  "triggerRuptures": [
    {
      "occurrenceTimeMillis": 758234847590,
      "comcatEventID": "ci3139781",
      "mag": 2.5,
      "latitude": 33.988,
      "longitude": -118.507,
      "depth": 2.285
    },
    {
      "occurrenceTimeMillis": 758359654980,
      "comcatEventID": "ci3139979",
      "mag": 3.57,
      "latitude": 33.984,
      "longitude": -118.504,
      "depth": 10.764
    },
    {
      "occurrenceTimeMillis": 758402885320,
      "comcatEventID": "ci3140049",
      "mag": 3.16,
      "latitude": 33.985,
      "longitude": -118.507,
      "depth": 11.484
    },
    {
      "occurrenceTimeMillis": 758809855390,
      "comcatEventID": "ci3144585",
      "mag": 6.7,
      "latitude": 34.213,
      "longitude": -118.537,
      "depth": 18.202,
      "ruptureSurfaces": [
        {
          "outline": [
            {
              "latitude": 34.315,
              "longitude": -118.421,
              "depth": 5.0
            },
            {
              "latitude": 34.401,
              "longitude": -118.587,
              "depth": 5.0
            },
            {
              "latitude": 34.261,
              "longitude": -118.693,
              "depth": 20.427
            },
            {
              "latitude": 34.175,
              "longitude": -118.527,
              "depth": 20.427
            },
            {
              "latitude": 34.315,
              "longitude": -118.421,
              "depth": 5.0
            }
          ]
        }
      ]
    }
  ],
  "cacheDir": "${ETAS_LAUNCHER}/inputs/cache_fm3p1_ba",
  "fssFile": "${ETAS_LAUNCHER}/inputs/2013_05_10-ucerf3p3-production-10runs_COMPOUND_SOL_FM3_1_SpatSeisU3_MEAN_BRANCH_AVG_SOL.zip",
  "probModel": "FULL_TD",
  "applySubSeisForSupraNucl": true,
  "totRateScaleFactor": 1.29,
  "gridSeisCorr": true,
  "timeIndependentERF": false,
  "griddedOnly": false,
  "imposeGR": false,
  "includeIndirectTriggering": true,
  "gridSeisDiscr": 0.1,
  "catalogCompletenessModel": "RELAXED",
  "etas_k_cov": 1.5,
  "maxPointSourceMag": 5.0,
  "configCommand": "u3etas_comcat_event_config_builder.sh --output-dir /expanse/lustre/projects/ddp408/ux454496/ucerf3_etas_test_cases/benchmark_1/data/20241017T210255-34546712/ --event-id ci3144585 --num-simulations 100000 --days-before 7 --etas-k-cov 1.5 --finite-surf-shakemap --finite-surf-shakemap-min-mag 6 --max-point-src-mag 5 --radius 40 --random-seed 123456789 --binary-output --nodes 14 --hours 3 --queue compute",
  "configTime": 1729224178916,
  "comcatMetadata": {
    "region": {
      "border": [
        {
          "latitude": 33.960713770187645,
          "longitude": -118.49631250732669
        },
        {
          "latitude": 33.97687648813803,
          "longitude": -118.5693649994406
        },
        {
          "latitude": 34.003274738398424,
          "longitude": -118.63796278505993
        },
        {
          "latitude": 34.01102284961943,
          "longitude": -118.65138277813915
        },
        {
          "latitude": 34.01102284961943,
          "longitude": -118.65138277813917
        },
        {
          "latitude": 34.01024223321693,
          "longitude": -118.65197698999785
        },
        {
          "latitude": 34.09593000786293,
          "longitude": -118.81760894301401
        },
        {
          "latitude": 34.096686464372894,
          "longitude": -118.81703462013031
        },
        {
          "latitude": 34.096686464372894,
          "longitude": -118.81703462013034
        },
        {
          "latitude": 34.125114486933185,
          "longitude": -118.86632374568815
        },
        {
          "latitude": 34.16931952229885,
          "longitude": -118.9200598743544
        },
        {
          "latitude": 34.220558071515015,
          "longitude": -118.96375893153834
        },
        {
          "latitude": 34.27728461580877,
          "longitude": -118.99608358423649
        },
        {
          "latitude": 34.33778487260579,
          "longitude": -119.01603327527896
        },
        {
          "latitude": 34.40022675228319,
          "longitude": -119.02297677100844
        },
        {
          "latitude": 34.46271526212202,
          "longitude": -119.01667431143473
        },
        {
          "latitude": 34.5233497859448,
          "longitude": -118.99728834611648
        },
        {
          "latitude": 34.58028204163827,
          "longitude": -118.96538211932044
        },
        {
          "latitude": 34.63177293717918,
          "longitude": -118.92190571840146
        },
        {
          "latitude": 34.6762465186584,
          "longitude": -118.86816961421852
        },
        {
          "latitude": 34.71233923968181,
          "longitude": -118.8058061876214
        },
        {
          "latitude": 34.73894288646782,
          "longitude": -118.73672022886673
        },
        {
          "latitude": 34.755239669256895,
          "longitude": -118.66302988711239
        },
        {
          "latitude": 34.76072823583111,
          "longitude": -118.587
        },
        {
          "latitude": 34.755239669256895,
          "longitude": -118.5109701128876
        },
        {
          "latitude": 34.73894288646782,
          "longitude": -118.43727977113326
        },
        {
          "latitude": 34.71233923968181,
          "longitude": -118.36819381237859
        },
        {
          "latitude": 34.70486869568452,
          "longitude": -118.35528570489859
        },
        {
          "latitude": 34.70486869568452,
          "longitude": -118.35528570489862
        },
        {
          "latitude": 34.70563414178679,
          "longitude": -118.35470455686568
        },
        {
          "latitude": 34.61932104863527,
          "longitude": -118.18834100459324
        },
        {
          "latitude": 34.61853118933769,
          "longitude": -118.18894225222245
        },
        {
          "latitude": 34.59024755310643,
          "longitude": -118.14012173480678
        },
        {
          "latitude": 34.545774404812,
          "longitude": -118.08644073616368
        },
        {
          "latitude": 34.4942839150534,
          "longitude": -118.04300855841609
        },
        {
          "latitude": 34.43735198862706,
          "longitude": -118.01113437387926
        },
        {
          "latitude": 34.37671767787822,
          "longitude": -117.99176737889243
        },
        {
          "latitude": 34.314229239433374,
          "longitude": -117.98547035097091
        },
        {
          "latitude": 34.251787281170785,
          "longitude": -117.99240569787446
        },
        {
          "latitude": 34.19128680559496,
          "longitude": -118.01233402908443
        },
        {
          "latitude": 34.13455992891716,
          "longitude": -118.04462486587286
        },
        {
          "latitude": 34.08332097382429,
          "longitude": -118.08827875602479
        },
        {
          "latitude": 34.03911550786521,
          "longitude": -118.14195977897162
        },
        {
          "latitude": 34.003274738398424,
          "longitude": -118.20403721494006
        },
        {
          "latitude": 33.97687648813803,
          "longitude": -118.2726350005594
        },
        {
          "latitude": 33.960713770187645,
          "longitude": -118.3456874926733
        },
        {
          "latitude": 33.95527176416889,
          "longitude": -118.42099999999999
        }
      ]
    },
    "eventID": "ci3144585",
    "minDepth": -10.0,
    "maxDepth": 36.404,
    "minMag": 2.5,
    "startTime": 758205055390,
    "endTime": 758809855390
  }
}